EtherView™ User Guide
Complete documentation for network monitoring and packet analysis with EtherView
rocket_launch Getting Started
System Requirements
Windows
- Windows 10/11 (x64 or ARM64)
- 4 GB RAM minimum
- 500 MB disk space Available
- Administrator privileges
macOS
- macOS 11+ (Intel or Apple Silicon)
- 4 GB RAM minimum
- 500 MB disk space Available
- Network permissions
Linux
- Ubuntu 20.04+ / Fedora 35+
- 4 GB RAM minimum
- 500 MB disk space Available
- libpcap installed
Installation
Download the appropriate installer for your platform from the Downloads page. Follow the installation instructions specific to your operating system.
Platform-Specific Notes
Windows
- Run the MSI installer and follow the wizard
- Right-click to "Run as Administrator" for first launch
- EtherView installs to
C:\Program Files\SanusSys\EtherView - Start Menu shortcuts are created automatically
macOS
- Open the DMG and drag EtherView to Applications
- On first launch, grant network access in System Preferences → Security & Privacy
- For Apple Silicon Macs, the native ARM64 version provides best performance
- If prompted about "unidentified developer," go to Security preferences and click "Open Anyway"
Linux
- Ubuntu/Debian: Install with
sudo dpkg -i etherview-*.deb - Fedora/RHEL: Install with
sudo rpm -i etherview-*.rpm - Run with
sudo etherviewor set capabilities:sudo setcap cap_net_raw+ep /usr/bin/etherview - Ensure libpcap is installed:
sudo apt install libpcap-dev
First Launch
1 Run as Administrator (Windows) or grant network permissions (macOS/Linux)
2 Enter your license key when prompted, or start the trial
3 Select a network interface from the dropdown menu
4 Click Start Capture to begin monitoring network traffic
License Activation
When you first launch EtherView, the License Activation dialog appears automatically. You have two options:
vpn_key Online Activation
- Enter your 28-character license key
- Click Activate License
- Your license is validated and stored locally
wifi_off Offline Activation
- Generate a machine fingerprint
- Submit via the Offline Portal
- Enter the activation response code
stars Feature Overview
Main Interface
EtherView's interface is designed for efficient network analysis with multiple synchronized views:

EtherView main interface during a live capture session
bubble_chart Network Graph
Interactive visualization showing hosts as nodes and connections as edges. Drag nodes to reposition, double-click to pin, right-click for options.
table_chart Packet Table
Real-time list of captured packets with source, destination, protocol, and timing information.
code Packet Details
Deep inspection panel showing protocol headers, payload data, and hex dump.
analytics Statistics
Live charts showing bandwidth usage, protocol distribution, and top talkers.
Interface Components
Menu Bar
- File: Open, save, export captures
- Capture: Start/stop, select interfaces and modes
- View: Layout options, zoom controls, full-screen mode
- Tools: Preferences, statistics, clear display
- Help: Documentation, license activation, about
Toolbar
Quick-access buttons for Start/Stop capture, Clear display, Refresh, Layout switching, and Zoom controls.
Legend Panel (Left Side)
Shows protocol colors, active protocol statistics, packet counts and percentages, and network summary information.
Status Bar (Bottom)
Displays current network interface, capture status (Running/Stopped), packet count, and performance indicators.
Multi-Tab Interface
EtherView features a powerful detachable tab system for monitoring multiple network views simultaneously:
Multiple tabs for organizing different network views
- Independent Filtering: Each tab can have its own packet filter
- Detachable Tabs: Drag tabs out to create floating windows for multi-monitor setups
- Tab Navigation: Use Ctrl+PgUp/Ctrl+PgDn to switch tabs
- Reattachment: Close floating windows to automatically reattach tabs

Detached windows for multi-monitor setups
Visualization Modes
Choose from multiple layout algorithms to visualize your network:
| Layout | Best For | Description |
|---|---|---|
| Force-Directed | General use, dynamic networks | Uses physics simulation—connected nodes attract, all nodes repel. Results in organic, self-organizing topology. |
| Circular | Small networks, presentations | Arranges nodes in a circle with equal spacing. Clean, symmetrical appearance. |
| Grid | Methodical analysis, documentation | Positions nodes in a rectangular grid. Highly organized with predictable positions. |
| Hierarchical | Client-server, network topology | Organizes nodes in tiers by importance. Central nodes at top, peripheral at bottom. |
Mouse & Interaction
Mouse Controls
- Left Click: Select node or link
- Left Drag: Move node
- Double Click: Pin/unpin node position
- Right Click: Context menu
- Mouse Wheel: Zoom in/out
- Middle Click + Drag: Pan the view
Node Information
- Size: Reflects activity level (more packets = larger)
- Color: Indicates primary protocol
- Tooltip: Shows IP, hostname, stats
- Links: Thickness = traffic volume
- Animation: Shows active data flow
sensors Capturing Packets
Selecting an Interface
Use the interface dropdown in the toolbar to select which network adapter to monitor:
- Ethernet – Wired network connections (eth0, en0)
- Wi-Fi – Wireless adapters (wlan0, en1)
- Loopback – Local traffic only (lo, localhost)
- Any – Capture from all interfaces simultaneously
Starting a Capture
1 Select your network interface from the dropdown
2 Optionally set a capture filter (see Using Filters)
3 Click the ▶ Start button or press Ctrl+E
4 Click ■ Stop or press Ctrl+E again to end capture
Capture Modes
EtherView offers three capture modes optimized for different analysis scenarios:
Link Layer (L0)
Captures complete Ethernet frames including MAC addresses. Use for low-level analysis, ARP traffic, and Layer 2 troubleshooting.
- Shows source and destination MAC addresses
- VLAN tag visibility
- Most comprehensive but resource-intensive
- Best for: Complete network analysis, switch debugging
IP Layer (L1)
Focuses on IP packets. Balanced performance and detail. Recommended for most users.
- Source and destination IP addresses
- Protocol identification (TCP, UDP, ICMP)
- TTL and fragmentation info
- Best for: General network monitoring
TCP Layer (L2)
Transport layer focus with TCP stream reassembly. Best for application traffic analysis and HTTP inspection.
- TCP/UDP port numbers
- TCP flags and sequence numbers
- Stream reassembly for application data
- Best for: Application debugging, HTTP/HTTPS analysis
Promiscuous Mode
By default, your network interface only captures packets addressed to your machine. Promiscuous mode allows capturing ALL packets on the network segment.
Normal Mode
- ✅ Packets to YOUR MAC address
- ✅ Broadcast packets
- ✅ Subscribed multicast groups
- ❌ Traffic between other devices
Promiscuous Mode
- ✅ ALL packets on the wire
- ✅ Traffic between other devices
- ✅ Full network visibility
- ⚠️ Requires admin/root privileges
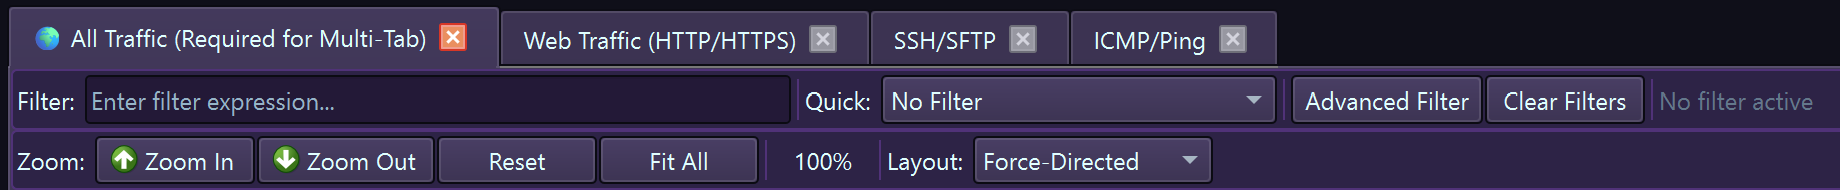
filter_alt Using Filters
Filters help you focus on specific traffic by capturing or displaying only packets that match your criteria. EtherView uses BPF (Berkeley Packet Filter) syntax, the same as Wireshark and tcpdump.
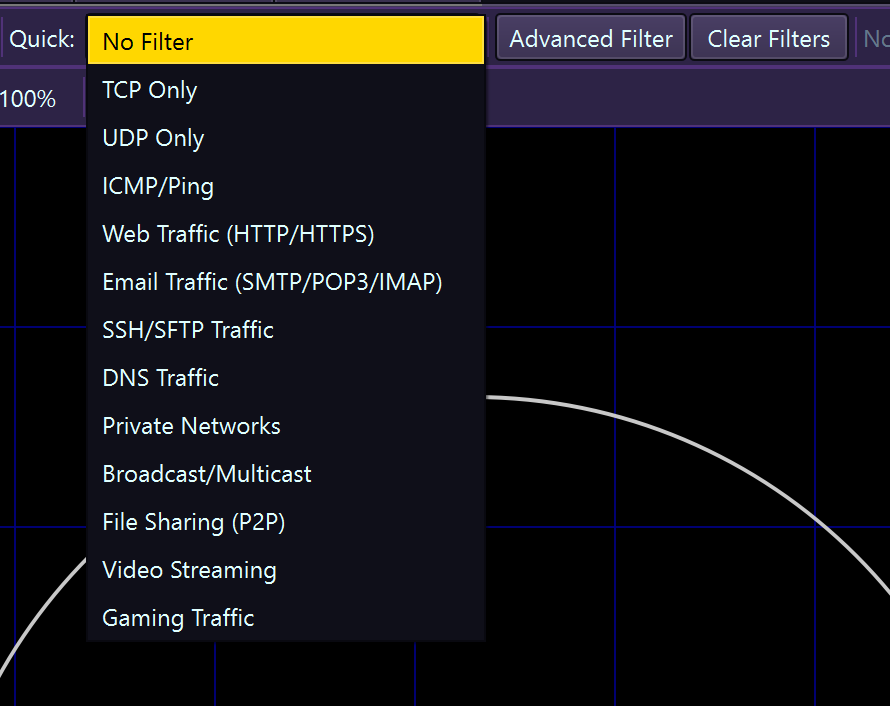
Quick filter bar for fast packet filtering
Filter Syntax
BPF filter syntax examples
| Type | Keywords | Example |
|---|---|---|
| Host | host, src host, dst host | host 192.168.1.100 |
| Network | net, src net, dst net | net 192.168.1.0/24 |
| Port | port, src port, dst port, portrange | port 443 |
| Protocol | tcp, udp, icmp, arp, ip, ip6 | tcp |
| Logical | and, or, not | tcp and port 80 |
Common Filter Examples
HTTP/HTTPS traffic
Traffic to/from a host
DNS queries only
Exclude SSH traffic
Traffic between two hosts
ICMP (ping) traffic
Non-standard ports only
Subnet traffic
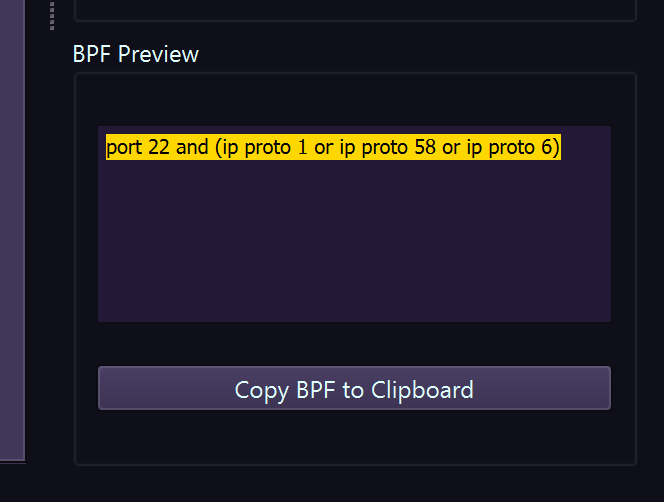
Advanced Filter Patterns
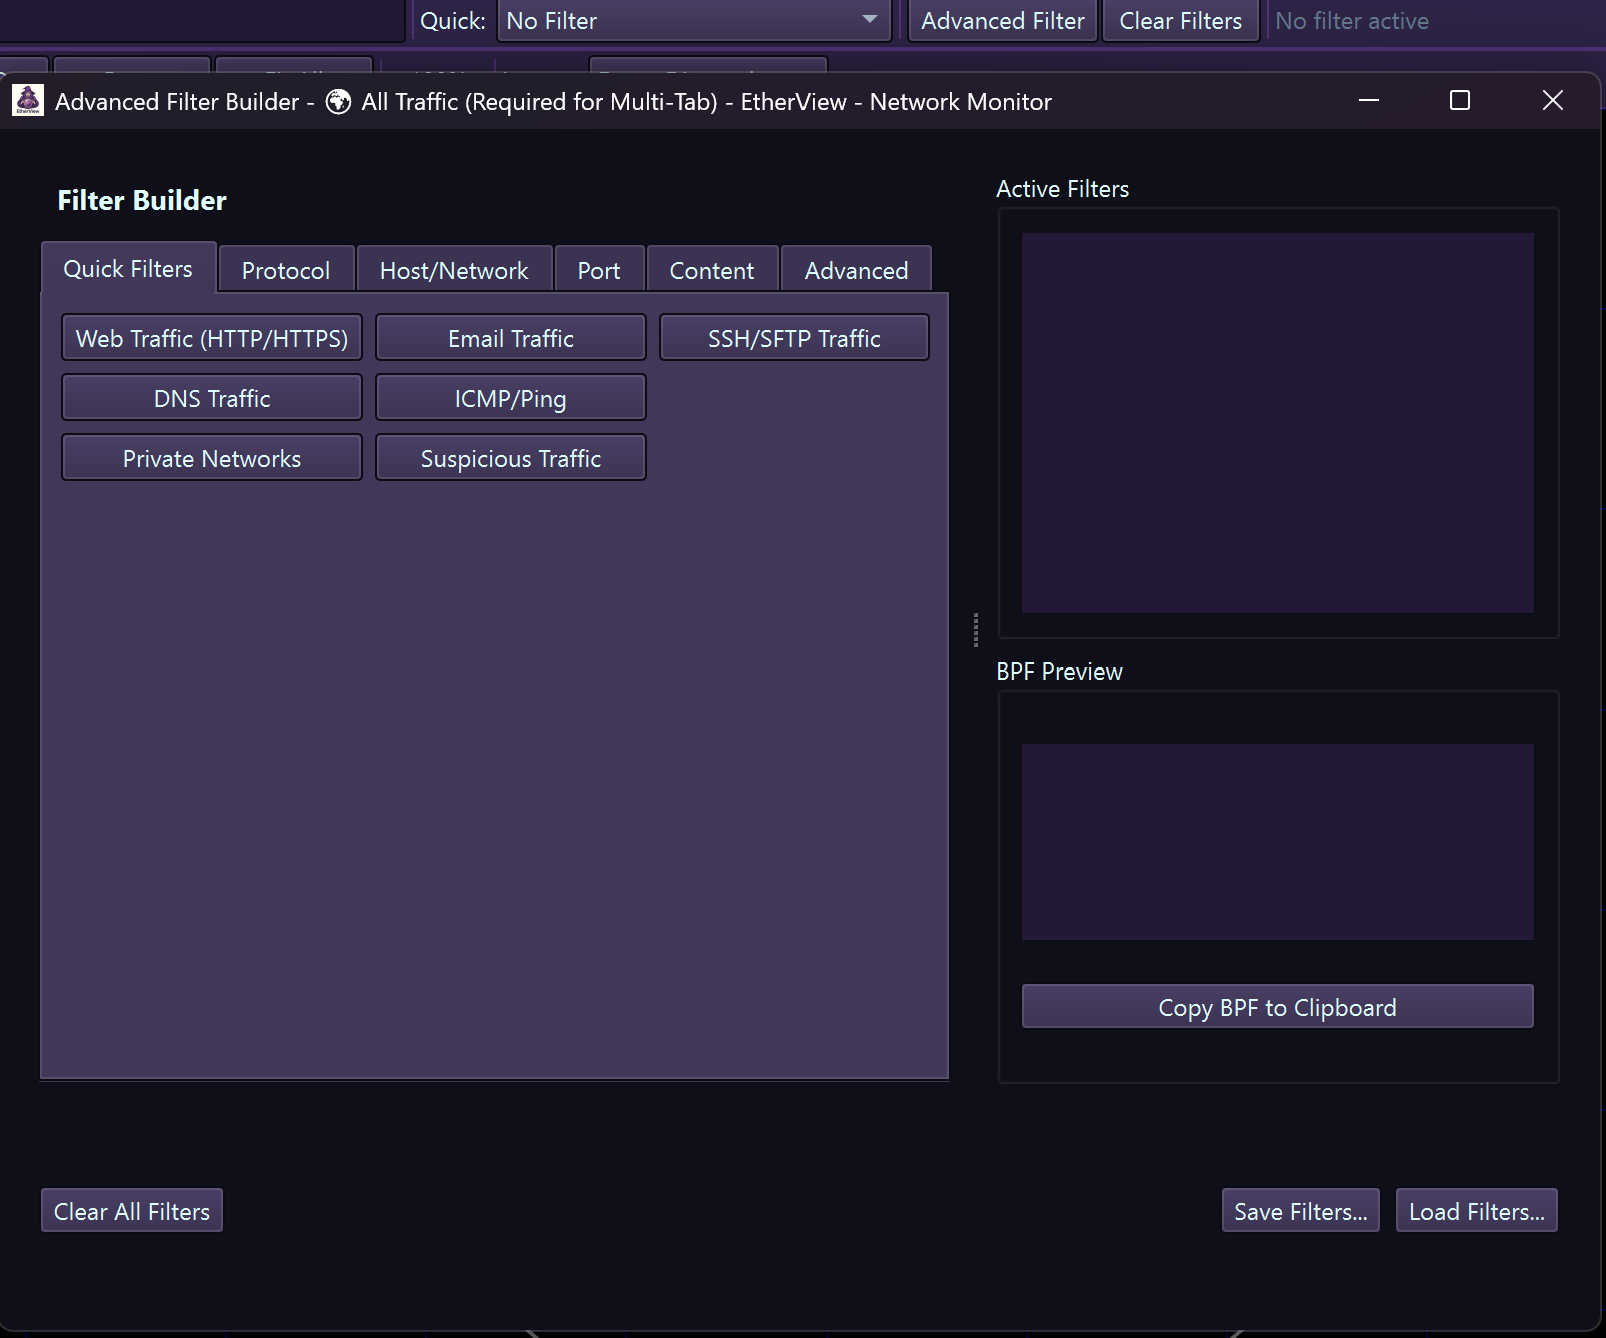
Advanced filter options panel
Advanced Filter Menu Categories
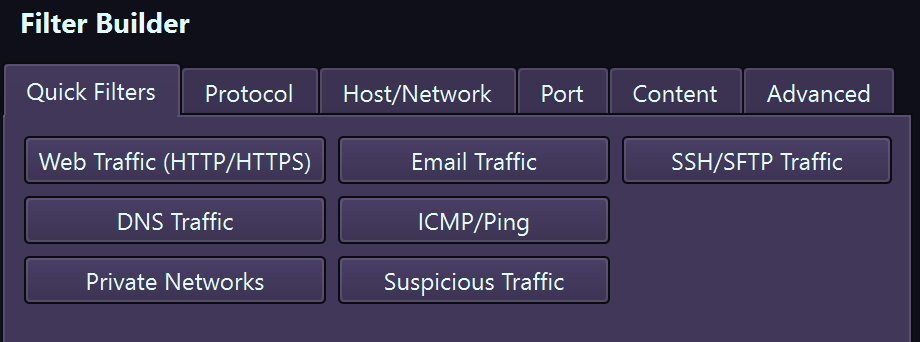
Quick Filters

Protocol Filters
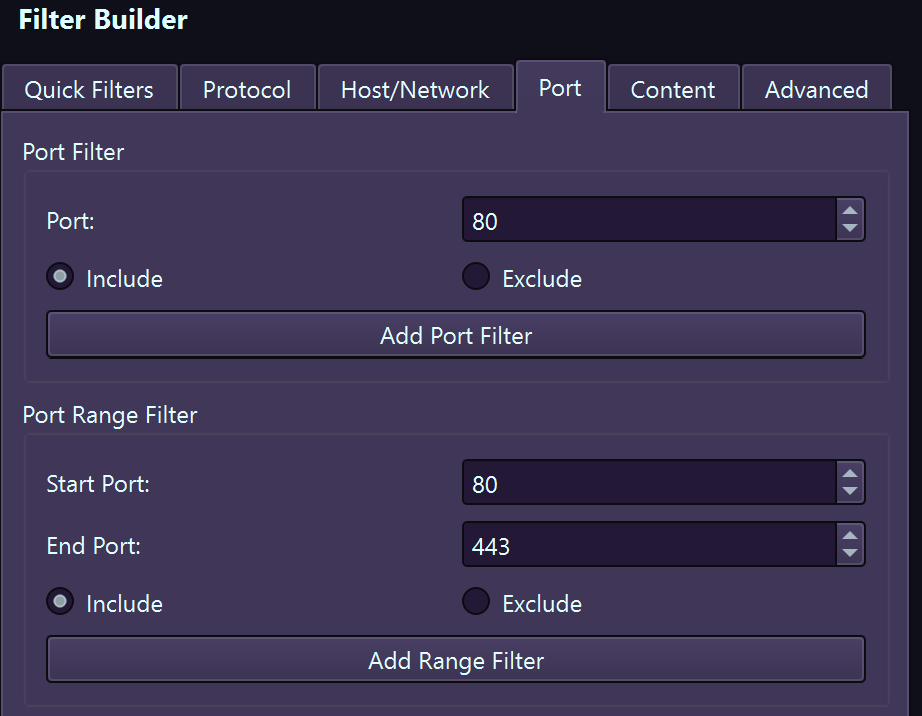
Port Filters
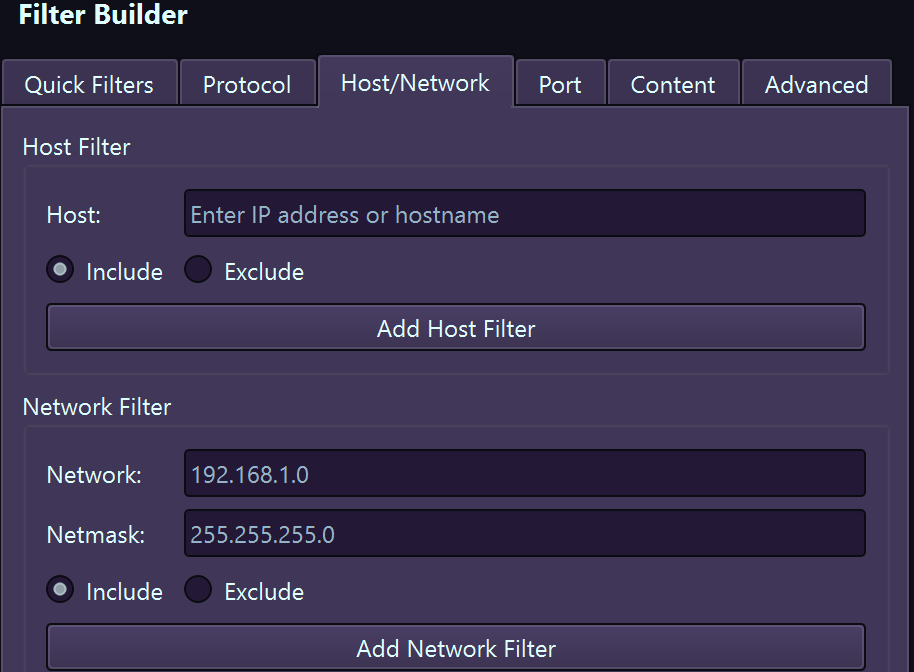
Host & Network Filters
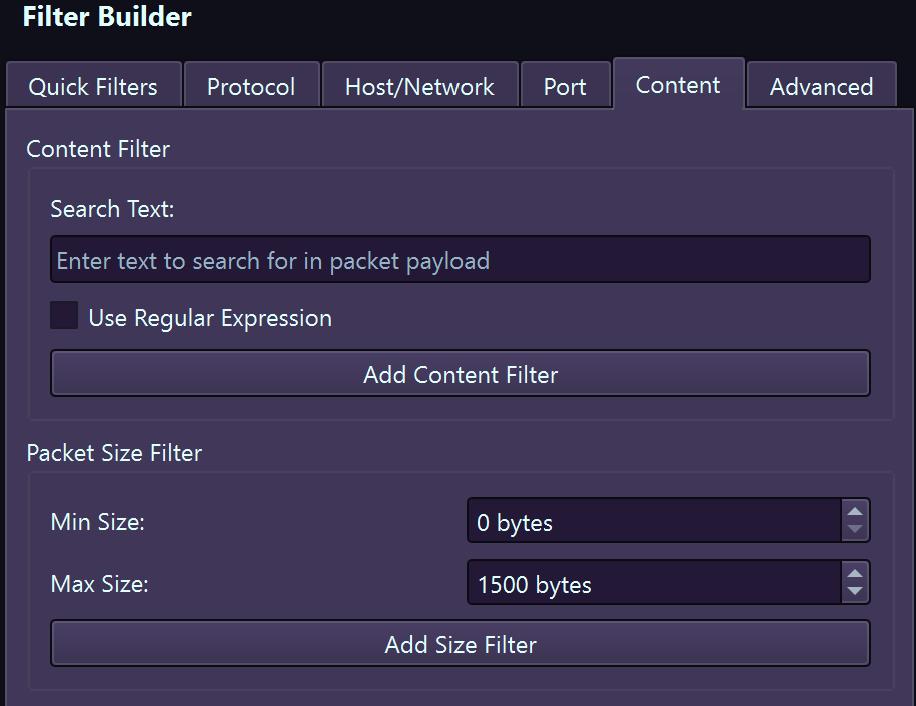
Content Filters

Advanced BPF Syntax
Security Monitoring Setup
Use multiple tabs with different filters:
Exclude broadcast and multicast
SSH connections to specific server
build Troubleshooting
error "No interfaces found" or empty interface list
Cause: Insufficient privileges or driver issue.
Solution:
- Windows: Right-click EtherView → Run as Administrator
- macOS: Grant network permissions in System Preferences → Security & Privacy → Privacy → Full Disk Access
- Linux: Run with
sudoor set capabilities:sudo setcap cap_net_raw+ep /usr/bin/etherview
warning No packets being captured
Cause: Wrong interface, restrictive filter, or no network activity.
Solution:
- Verify you selected the correct network interface (check with
ip addron Linux oripconfigon Windows) - Try removing or simplifying your capture filter
- Ensure network traffic is occurring (browse a website to generate traffic)
- On switched networks, you'll only see traffic to/from your machine unless port mirroring is enabled
warning License activation failed
Cause: Network connectivity issue or incorrect key format.
Solution:
- Verify your license key is entered correctly—dashes are optional
- Check key format:
EVPR-XXXX...(Personal) orEVBS-XXXX...(Business) - Ensure internet connectivity for online activation
- Check if a firewall is blocking outbound HTTPS connections
- For air-gapped systems, use Offline Activation
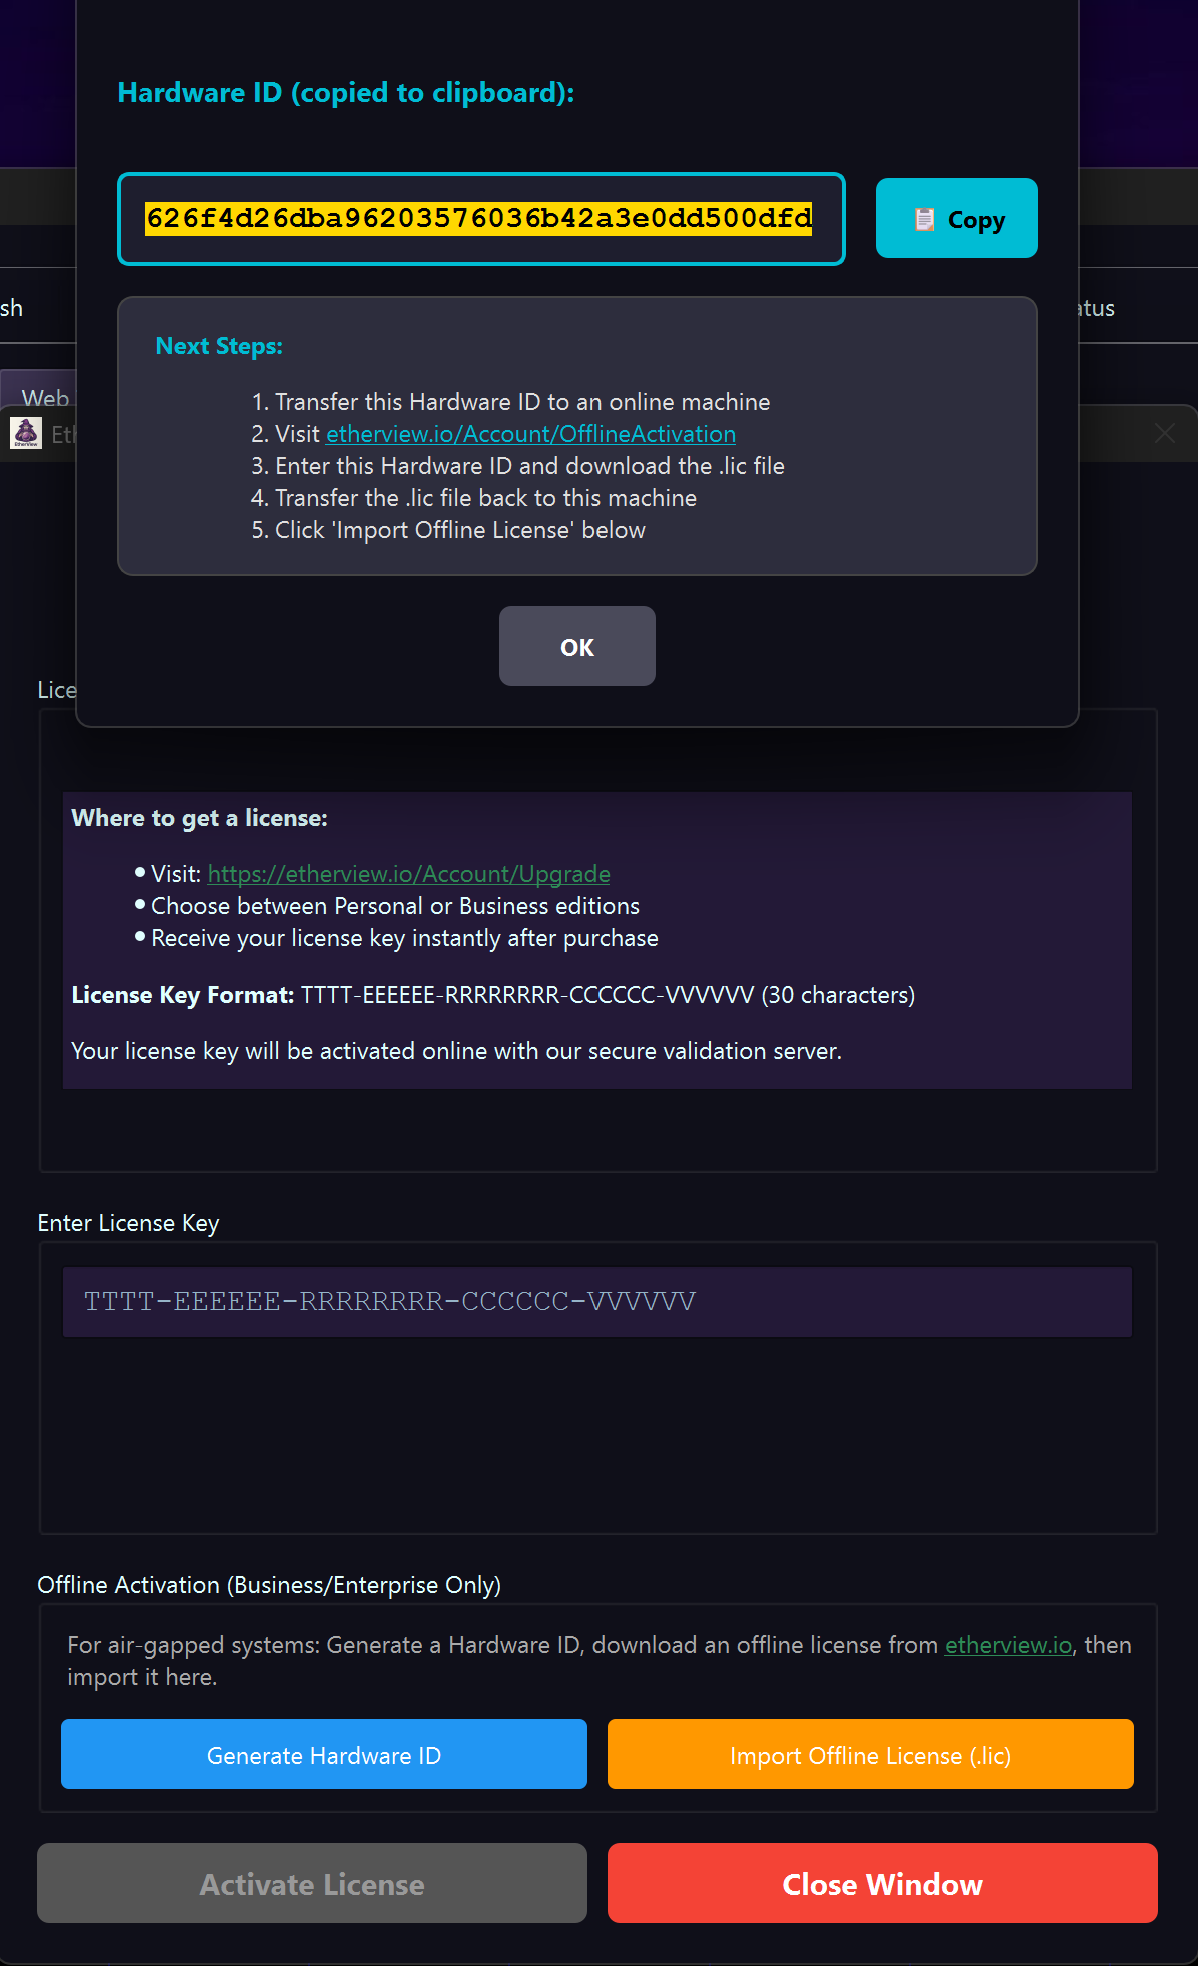
License Manager with Hardware ID generation for offline activation
info High CPU or memory usage
Cause: High traffic volume, long sessions, or too many nodes.
Solution:
- Use capture filters to reduce the volume of captured packets
- Reduce maximum nodes in preferences (Tools → Preferences → Performance)
- Increase timeout values to reduce node churn
- Stop and save captures periodically rather than running indefinitely
- Disable real-time graph animations for very high traffic networks
info Application crashes on startup
Cause: Missing dependencies, corrupted settings, or graphics driver issues.
Solution:
- Windows: Install Visual C++ Redistributable 2022
- Linux: Verify libpcap is installed:
sudo apt install libpcap-dev - Delete settings file and restart:
- Windows:
%APPDATA%\SanusSys\EtherView.conf - Linux:
~/.config/EtherView/EtherView.conf - macOS:
~/Library/Preferences/EtherView.conf
- Windows:
- Update graphics drivers for OpenGL support
dns Hostnames not resolving
Cause: DNS resolution disabled or DNS server unreachable.
Solution:
- Enable name resolution in Tools → Preferences → Network
- Verify DNS connectivity:
nslookup google.com - Some internal IPs may not have PTR records and will only show IP addresses
Debug Logging
For advanced troubleshooting, enable debug output:
# Linux/macOS

export QT_LOGGING_RULES="etherview.*=true"

sudo ./etherview 2>&1 | tee debug.log


# Windows PowerShell

$env:QT_LOGGING_RULES="etherview.*=true"

.\etherview.exe 2>&1 | Tee-Object debug.log
fiber_smart_record Recording & Playback
EtherView's Temporal Lattice system allows you to record network activity and replay it later with full timeline control. This is invaluable for incident analysis, training, and documentation.

Temporal Lattice (4D-LAT) recording and playback in action
Recording a Session
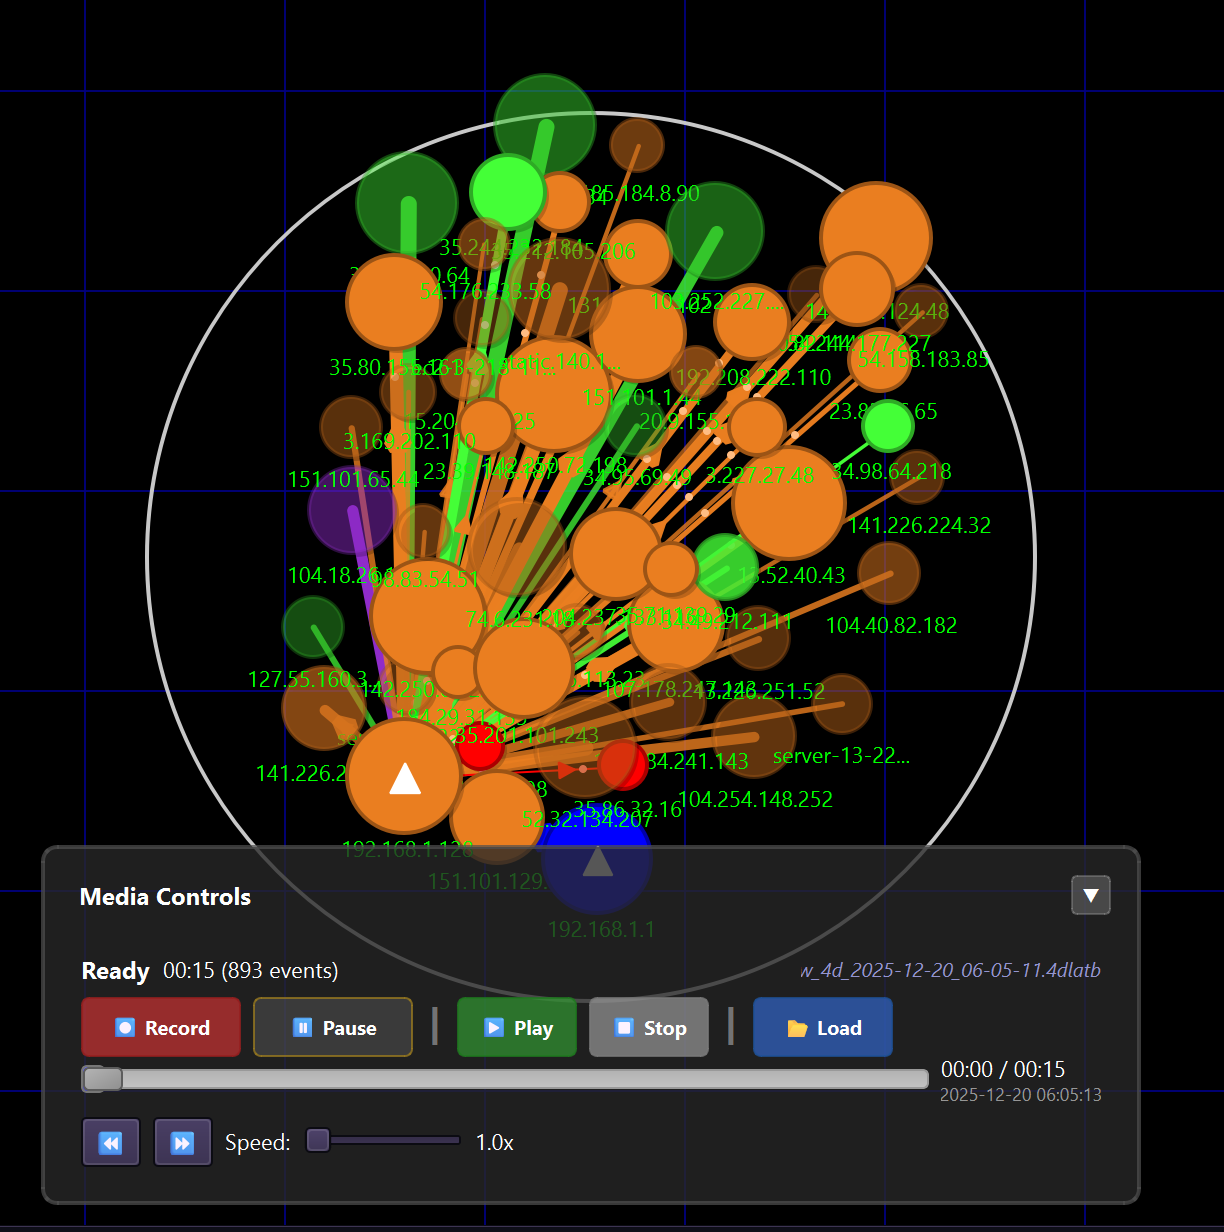
4D Lattice recording interface with timeline controls
1 Start a packet capture on your desired interface
2 Click the ⏺️ Record button in the Media Controls panel
3 The recording indicator shows elapsed time and event count
4
Click ⏹️ Stop and save to a .4dlat file
Playing Back a Recording
1
Go to File → Open Recording and select a .4dlat file
2 Click ▶️ Play to start playback
3 Use the timeline slider to jump to specific points
4 Click ⏸️ Pause to freeze and analyze at any moment
schedule Recording Features
- Pause and resume recording
- Real-time event counter
- Automatic save prompts
- Export to PCAP format
play_circle Playback Features
- Variable playback speed
- Timeline scrubbing
- Timestamp display
- Frame-by-frame stepping
public World Map View
The World Map View provides real-time geographic visualization of your network traffic, showing where connections originate and terminate around the globe using OpenStreetMap tiles and MaxMind GeoIP database (installed separately).
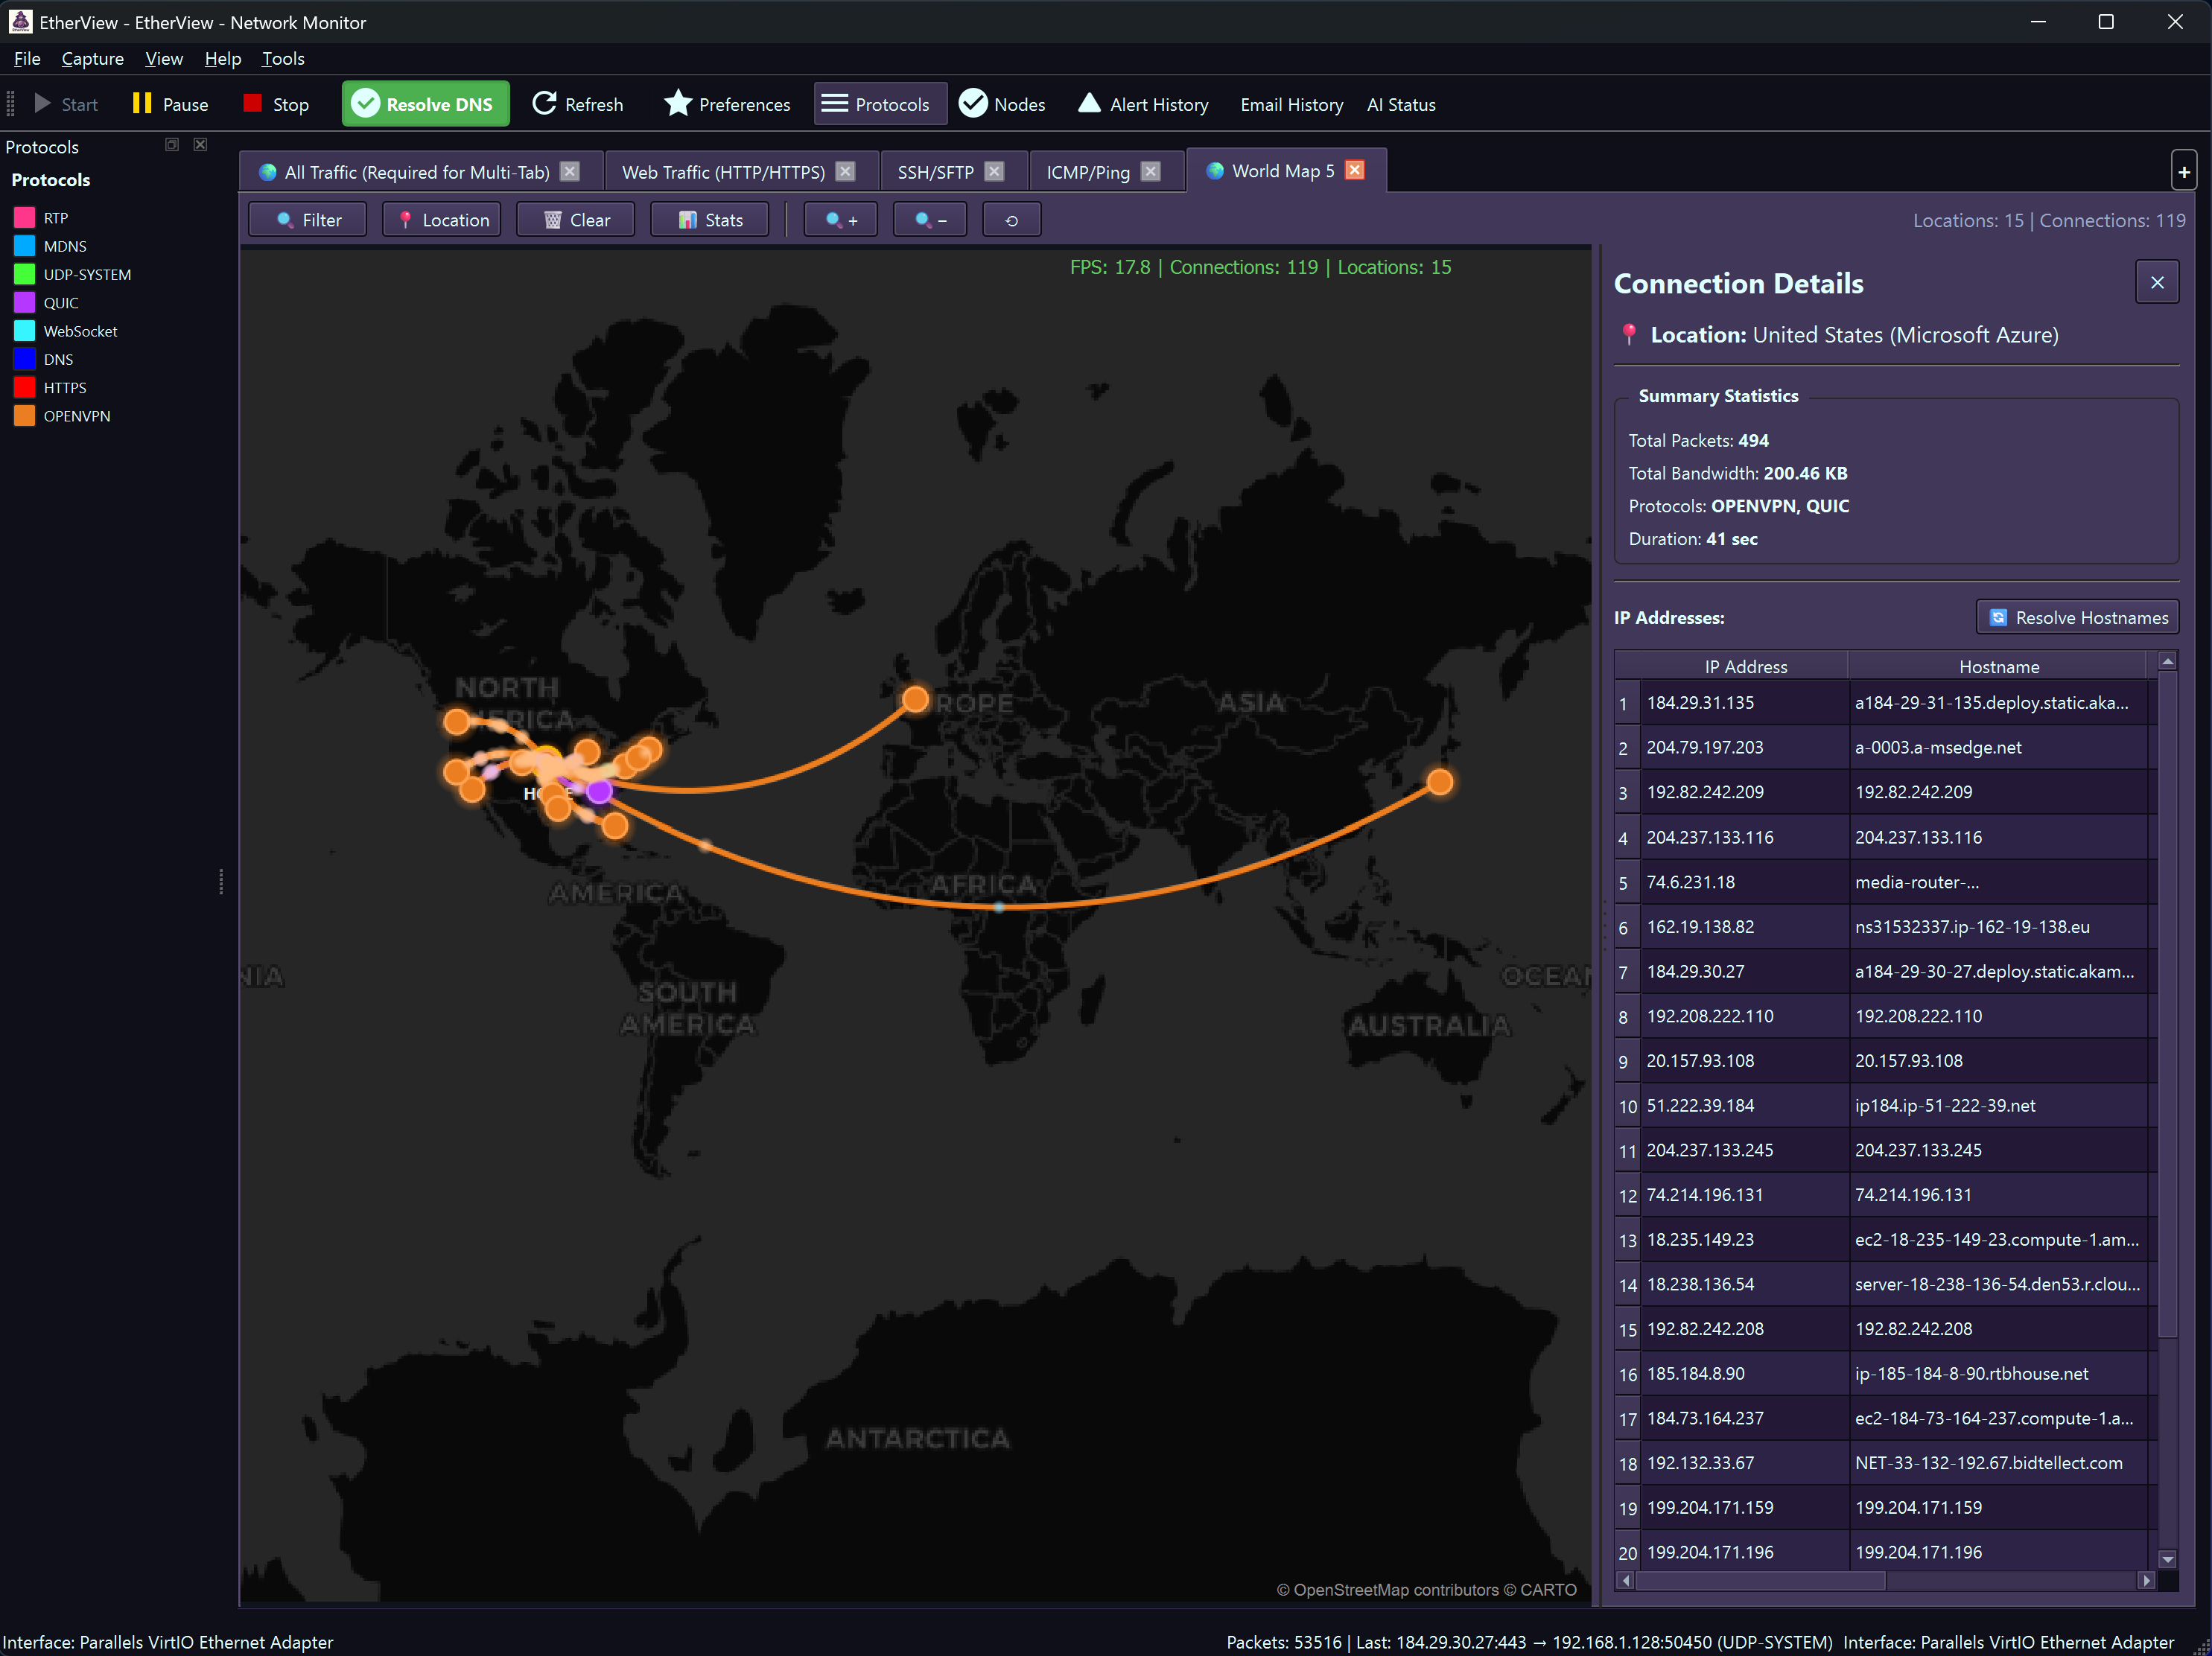
World Map showing global network connections in real-time
Opening the World Map
1 Click New Tab dropdown → World Map
2 Start or continue packet capture
3 Watch connections appear on the map with animated arcs!
Map Features
place Geographic Pins
- Remote endpoints shown as location pins
- Your location marked with gold pin
- Click pins for detailed connection info
timeline Connection Arcs
- Curved lines connect your location to endpoints
- Color indicates protocol (HTTP, SSH, DNS, etc.)
- Thickness represents bandwidth
- Animated dots show traffic flow direction
analytics Statistics Panel
- Active connections and total bandwidth
- Top 10 countries by traffic
- Protocol breakdown with percentages
- Resizable and collapsible
info Connection Details
- Click any pin for IP address list
- Hostname resolution (reverse DNS)
- Organization info from ASN database
- Per-IP bandwidth and packet stats
GeoIP Database Setup
For accurate IP geolocation, EtherView uses MaxMind's GeoLite2 database. A free account is required.
1 Sign up for free MaxMind account at maxmind.com
2 Download GeoLite2-City.mmdb and optionally GeoLite2-ASN.mmdb
3 Place in one of the auto-detected locations (see table below)
| Platform | Database Locations (Auto-Detected) |
|---|---|
| Windows | C:\ProgramData\MaxMind\ or same folder as EtherView.exe |
| macOS | ~/Library/Application Support/GeoIP/ or /usr/local/share/GeoIP/ |
| Linux | /usr/share/GeoIP/ or ~/.local/share/etherview/ |
Map Controls
| Zoom | Mouse wheel or +/- buttons |
| Pan | Click and drag the map |
| Reset View | Click the reset ⟲ button |
| 📍 Location | Set your local position |
| 📊 Stats | Toggle statistics panel |
| 🗑️ Clear | Clear all connections |
security AI-Powered Intrusion Detection
EtherView includes an intelligent Intrusion Detection System (IDS) that automatically analyzes network traffic patterns to identify potential security threats in real-time.
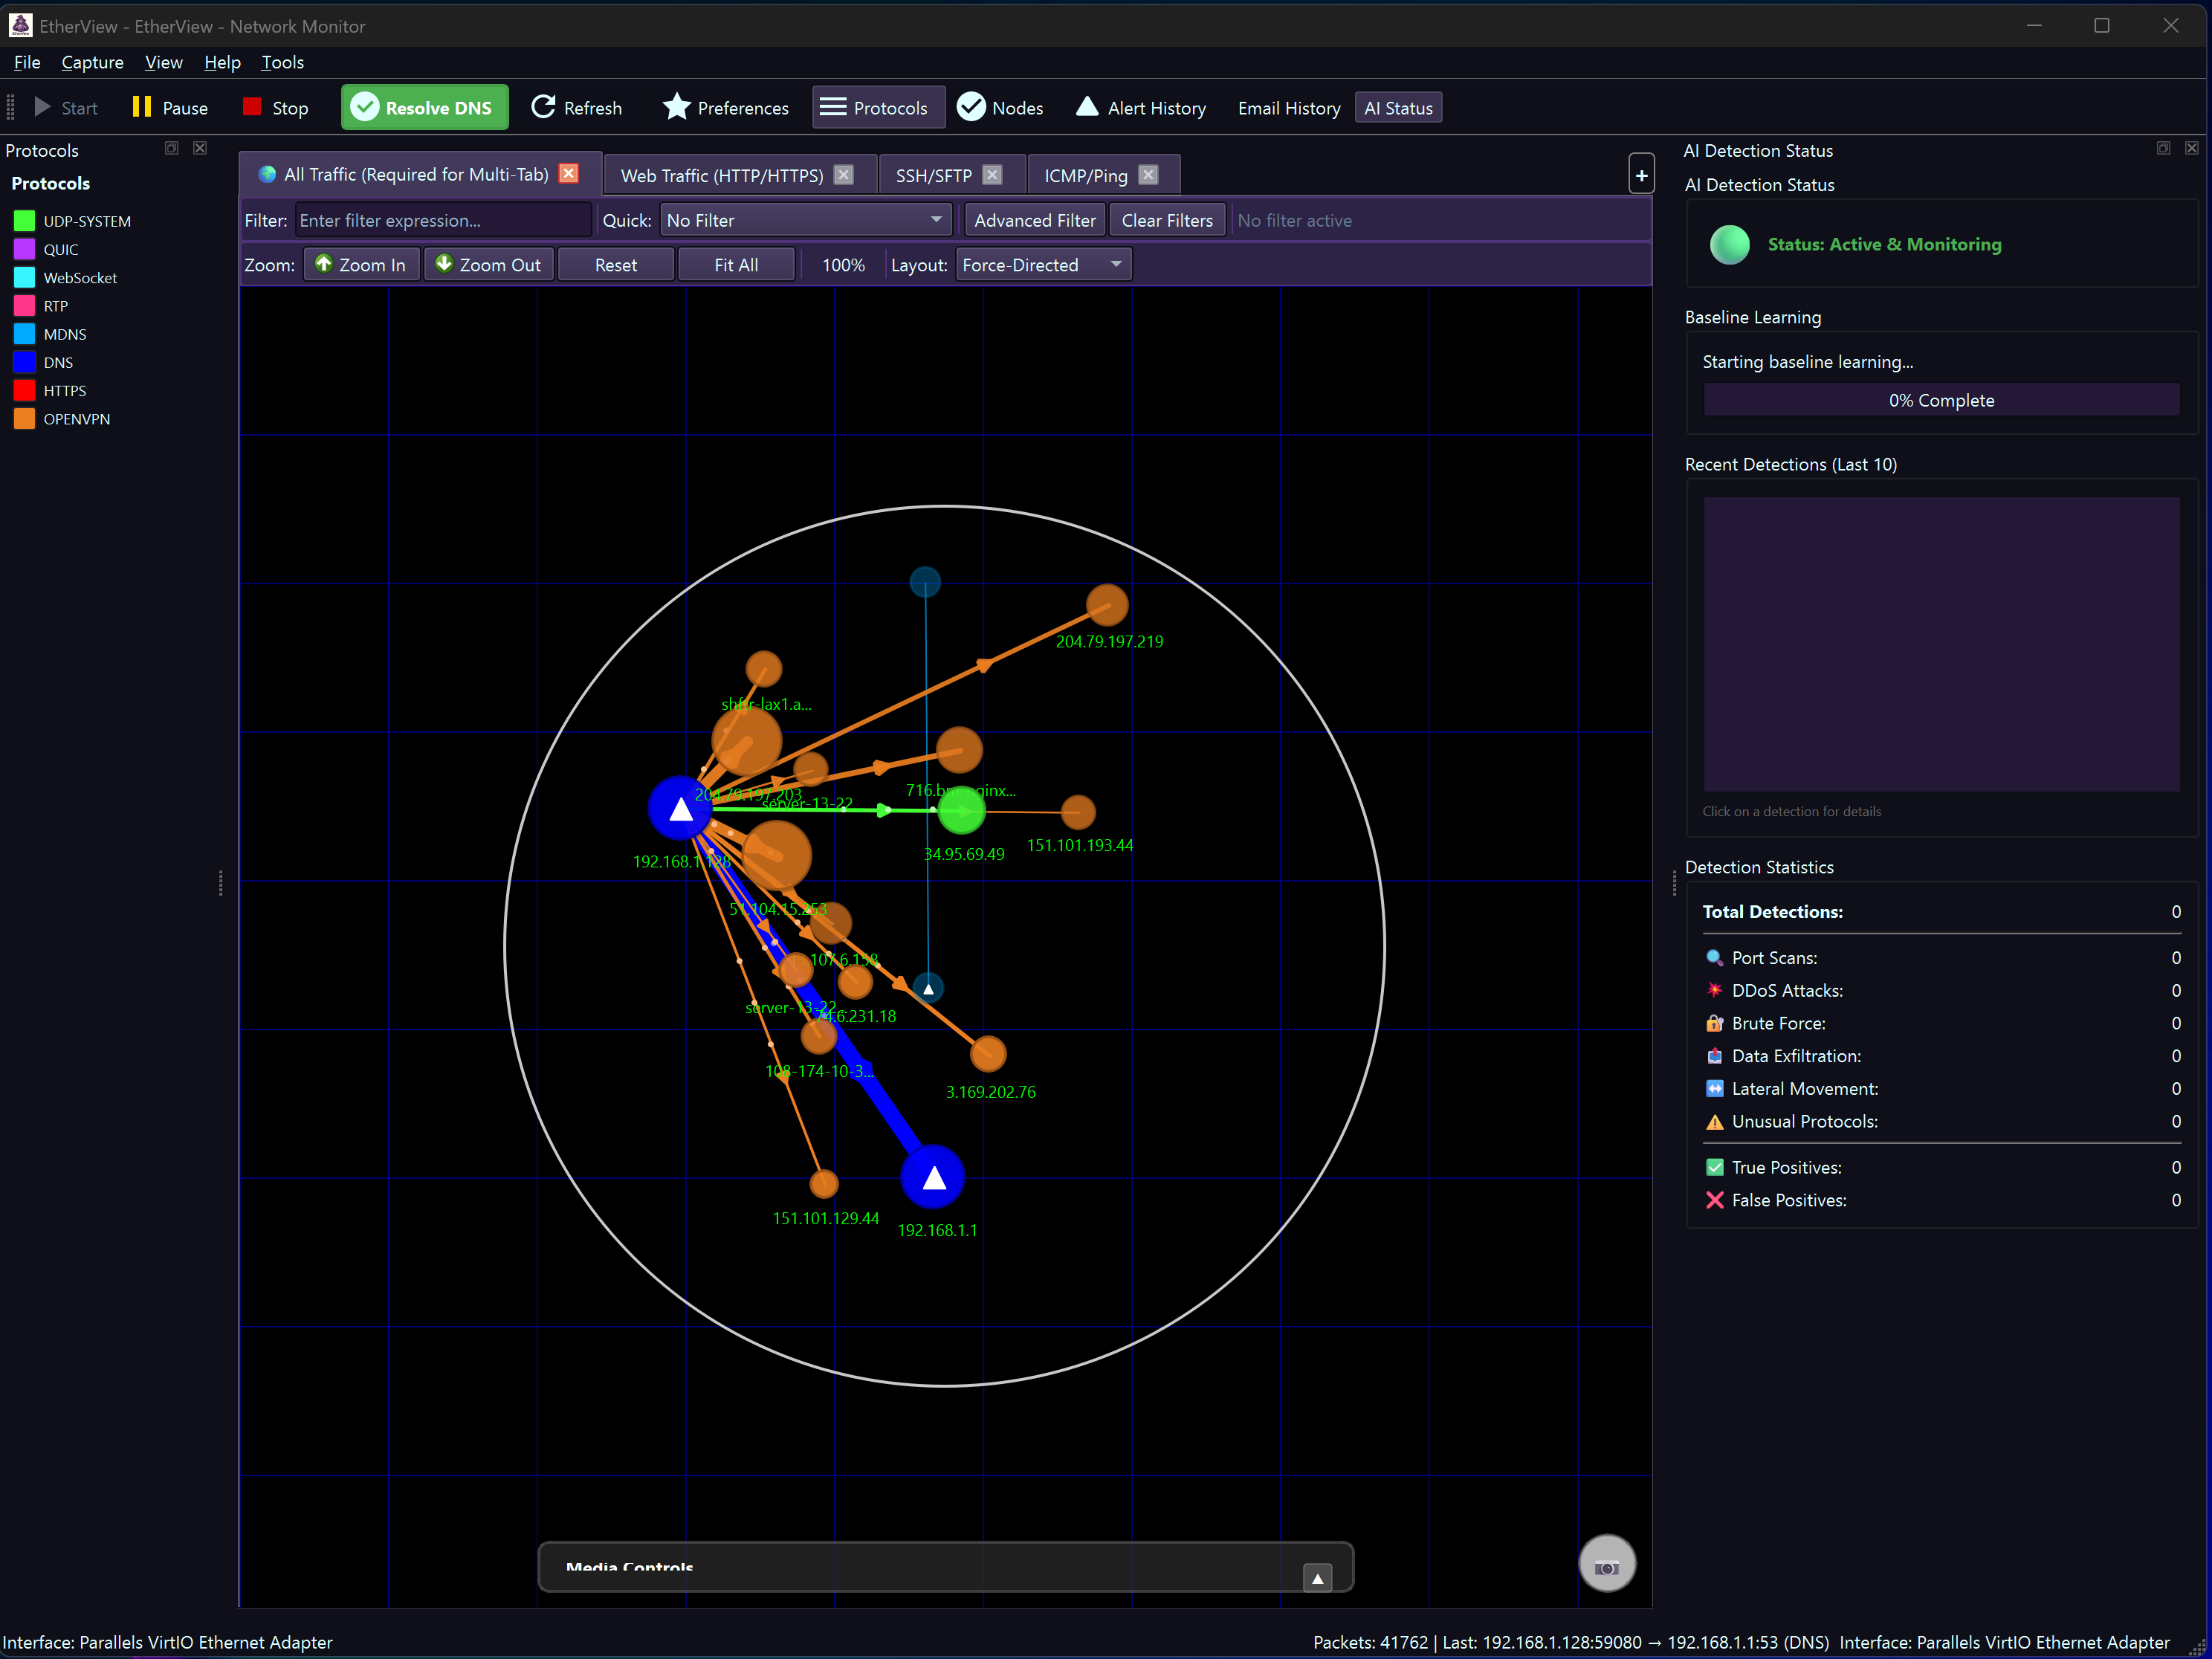
AI-powered threat detection with training capabilities
Threat Detection Algorithms
radar Port Scanning Detection
Identifies hosts probing multiple ports on target systems—a common reconnaissance technique.
flash_on DDoS Detection
Detects volume-based attacks and connection floods targeting specific hosts.
lock_open Brute Force Detection
Monitors for repeated authentication attempts against SSH, RDP, and other services.
cloud_upload Data Exfiltration
Flags unusual outbound data transfers that may indicate data theft.
device_hub Lateral Movement
Detects internal network reconnaissance and attackers moving between hosts.
help_outline Unusual Protocols
Identifies unexpected protocol usage that may indicate malware or tunneling.
Alert System
When threats are detected, EtherView can take multiple actions:
notifications Notifications
Desktop notifications with severity levels (Info, Warning, Critical)
volume_up Sound Alerts
Audible alerts for high-priority threats
email Email Notifications
Send alerts to security team email addresses
history Logging
Detailed event logs for forensic analysis
notifications_active Alert System
EtherView's Alert System provides customizable rules to monitor network conditions. Configure alerts for traffic thresholds, protocol detection, topology changes, and security events.
Alert Types
speed Traffic Threshold
Alert when bandwidth exceeds a limit (e.g., 10 MB/s). Useful for congestion and large transfer detection.
lan Packet Rate Threshold
Detect abnormally high packet rates (e.g., >5000 pps). Helps identify DDoS attacks and packet storms.
router Protocol Detected
Alert on specific protocols (e.g., BitTorrent, TELNET). Enforce security policies and compliance.
device_hub Node Appeared/Disappeared
Track when new devices join or leave the network. Detect unauthorized devices and monitor availability.
flash_on Connection Burst
Detect rapid connection attempts (e.g., 75 in 5 seconds). Identifies connection floods and aggressive scanning.
warning Suspicious Activity
Advanced threat detection: blacklist matching, port scanning, brute force attempts, and traffic anomalies.
storage Bandwidth Exceeded
Alert when cumulative bandwidth exceeds a cap (e.g., 1 GB). Manage data caps and cloud egress costs.
group Node Count Threshold
Monitor when active node count exceeds a limit. Useful for network scanning detection and capacity planning.
Creating Alert Rules
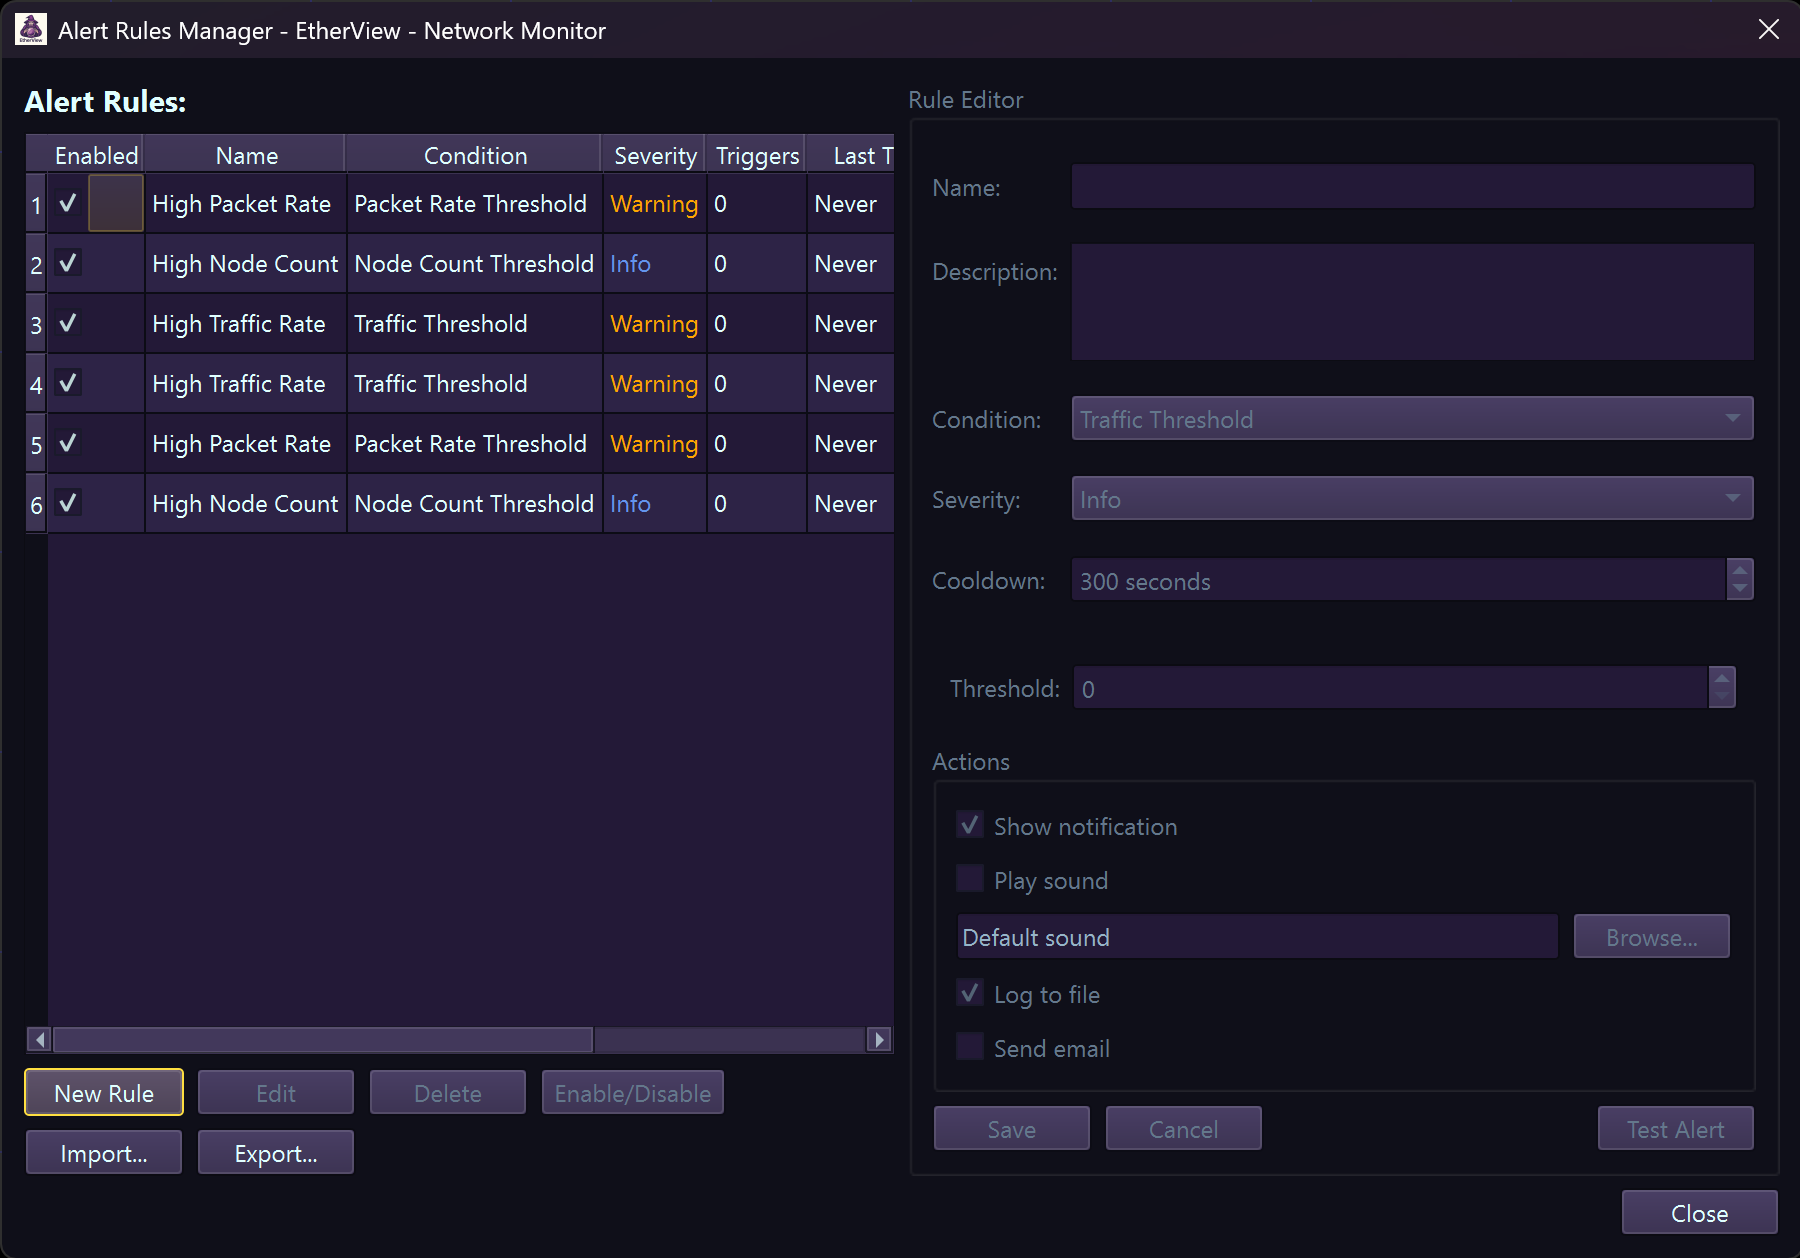
Alert rule management interface
1 Go to Tools → Alert Settings or click the bell icon in toolbar
2 Click Add Rule and select an alert type
3 Configure parameters (threshold, protocol, severity)
4 Set notification options (sound, email, cooldown period)
5 Click OK to save—rule activates immediately
Email Notifications
Configure email alerts to stay informed when you're away from the console.
Gmail Setup
- Server:
smtp.gmail.com - Port:
587(STARTTLS) - Use App Password (not account password)
- Generate App Password →
Office 365 Setup
- Server:
smtp.office365.com - Port:
587(STARTTLS) - Use your work email and password
- May require admin approval for SMTP
IP Blacklist/Whitelist
Manage lists of trusted and blocked IP addresses for alert filtering:
- Blacklist: Alert on any traffic from these IPs (known malicious, C&C servers)
- Whitelist: Suppress alerts from trusted IPs (backup servers, scanners you control)
- Wildcards: Support patterns like
192.168.1.*
# Example blacklisted_ips.txt

10.0.0.1

192.168.100.*

203.0.113.5

# Known malware C&C

185.234.218.0/24
Alert History
View and manage past alerts in the Alert History panel. Filter by severity, time range, or alert type.
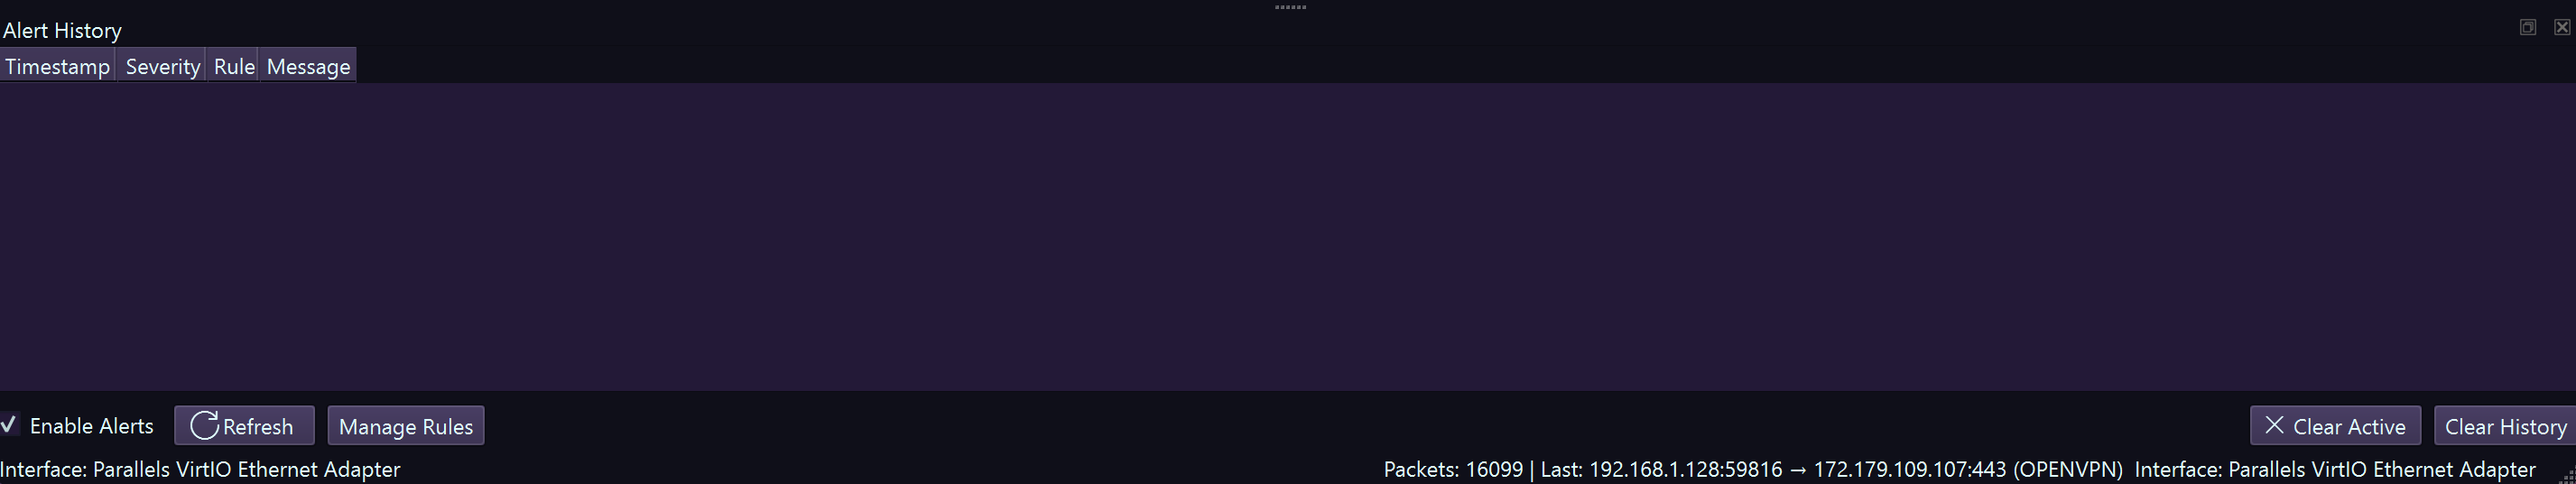
Alert history showing past security events
settings Preferences
Customize EtherView's behavior and appearance via Tools → Preferences. Settings are organized into logical categories for easy navigation.
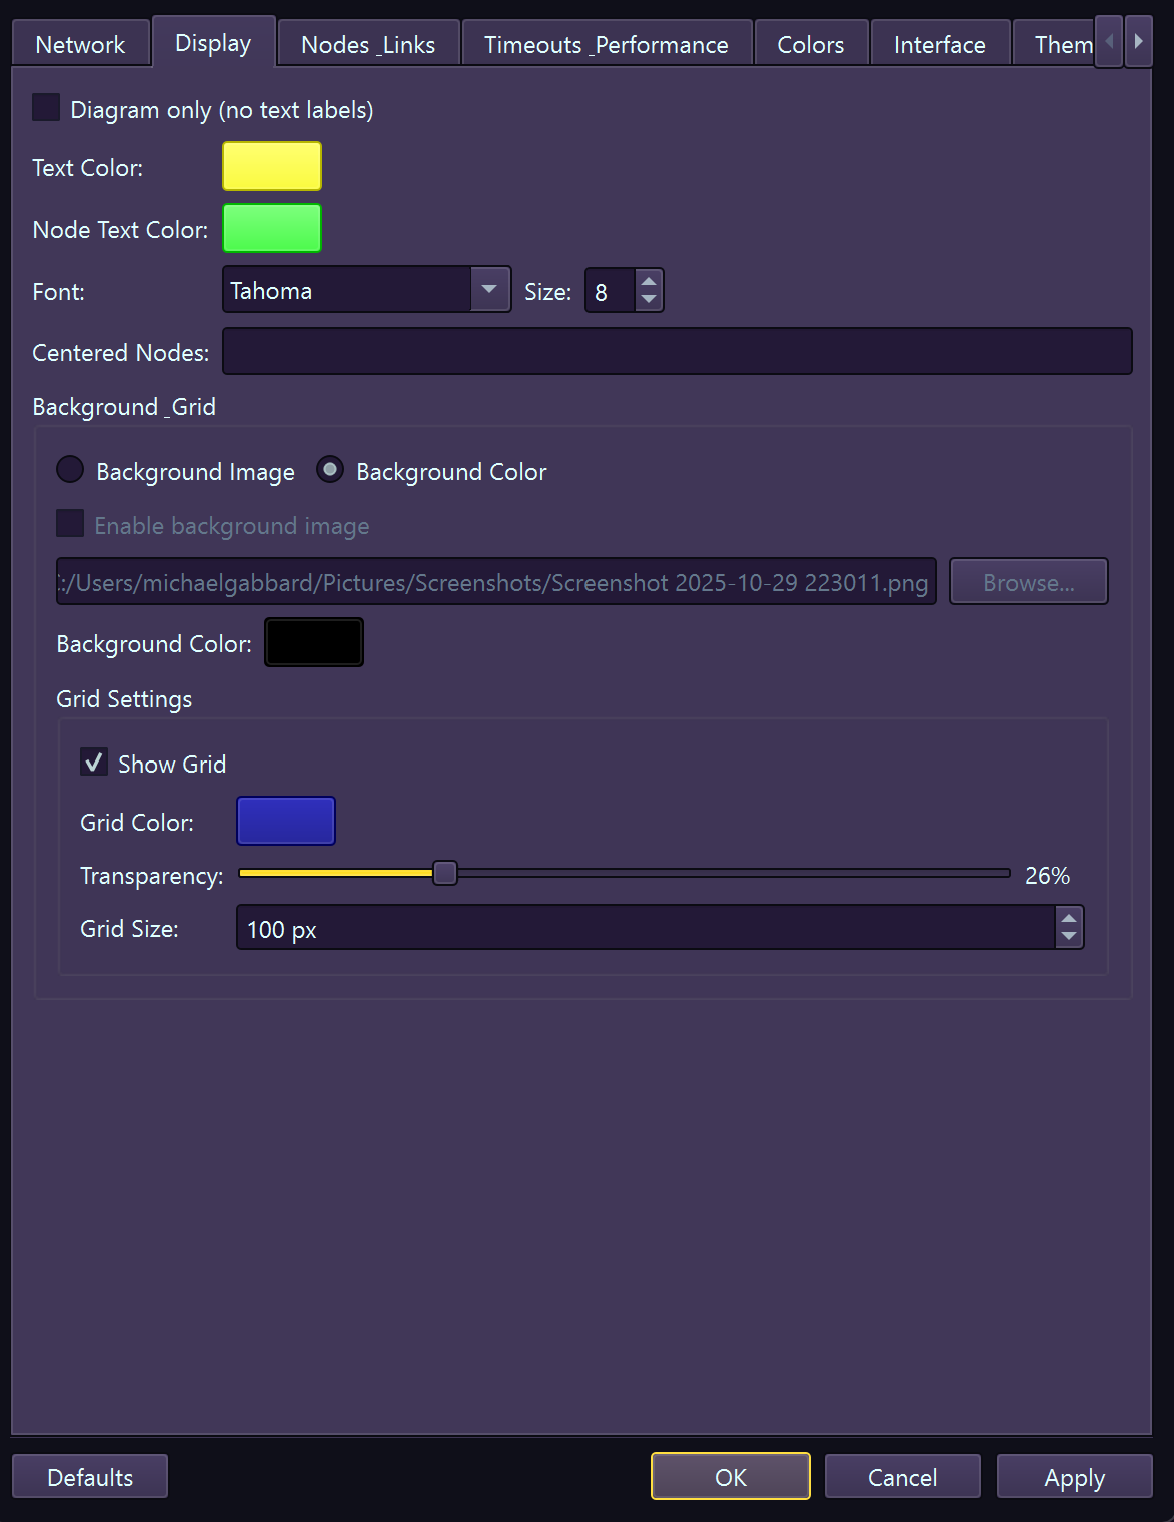
Display – Font sizes, scaling, animations
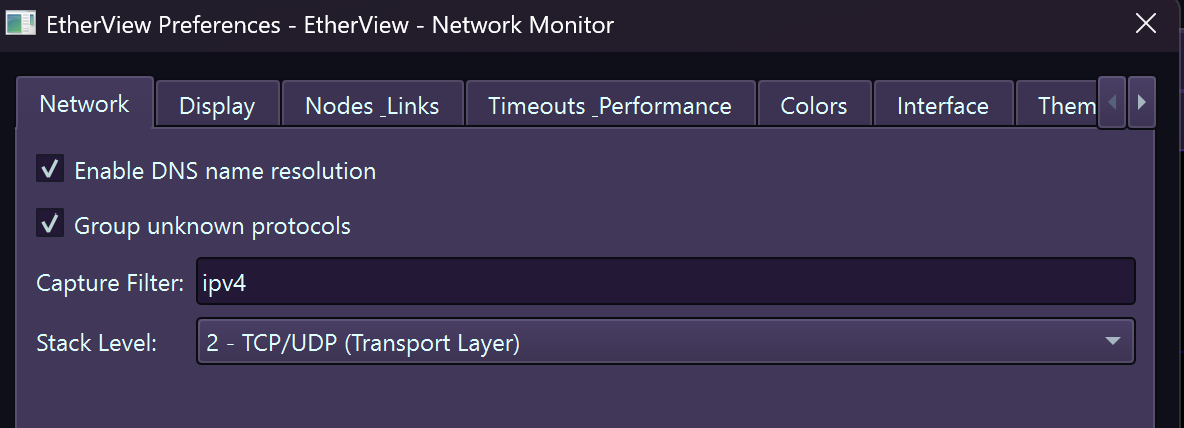
Network – DNS resolution, timeouts, buffer sizes

Node & Links – Graph sizing, physics settings
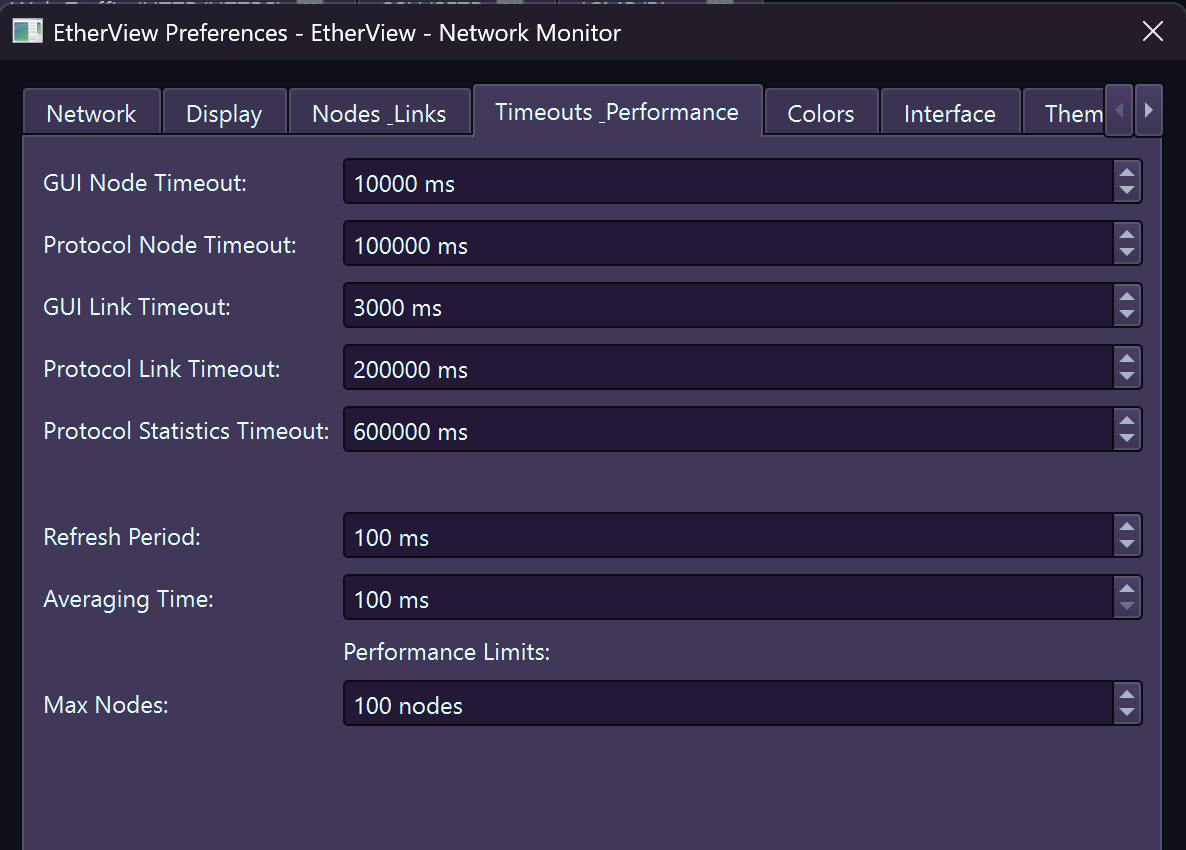
Timings – Refresh rates, fade durations
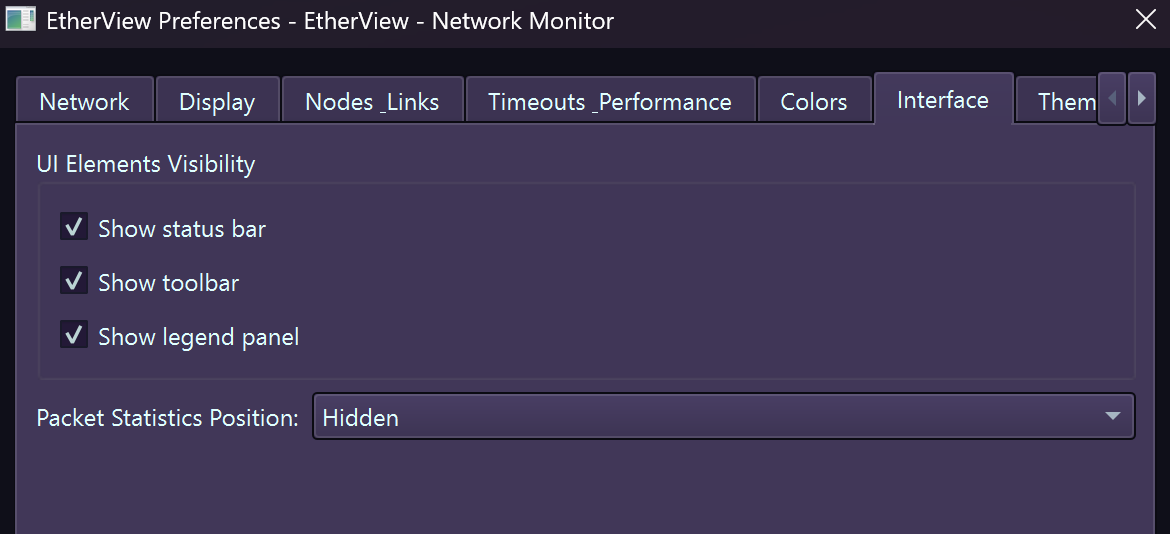
UI Elements – Panel visibility, layout options
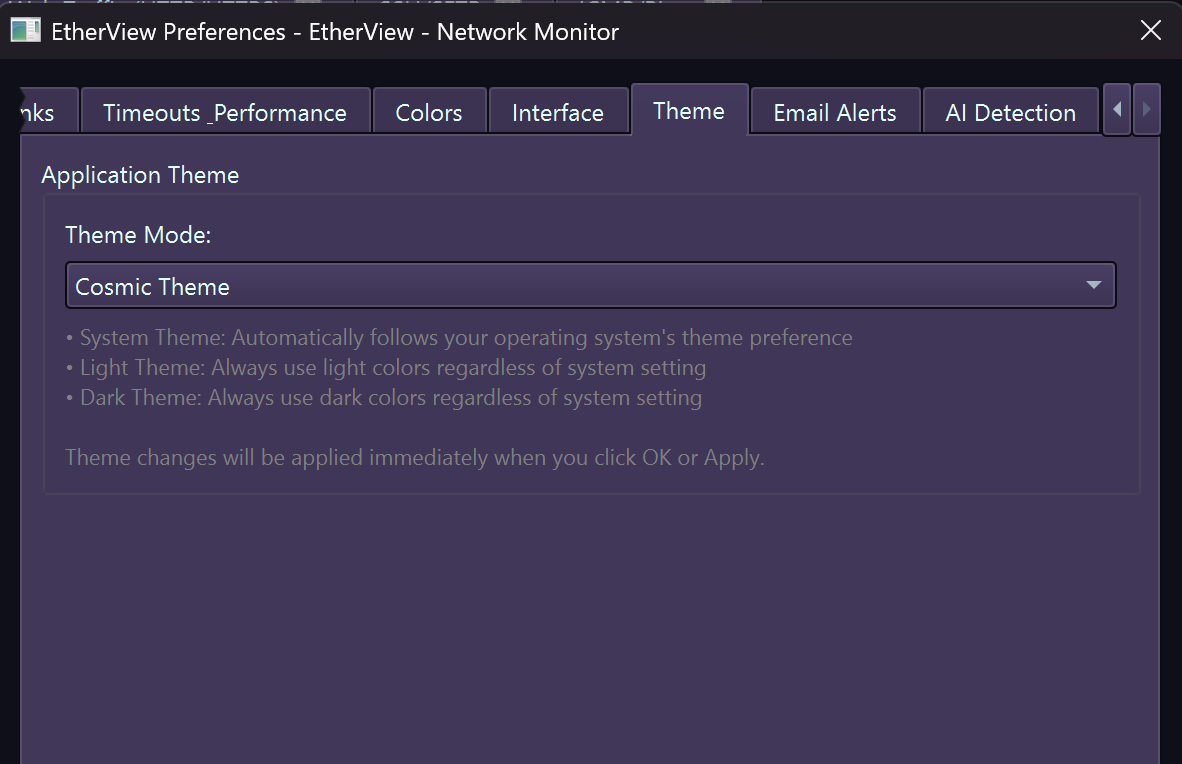
Theme – Color schemes, dark/light mode
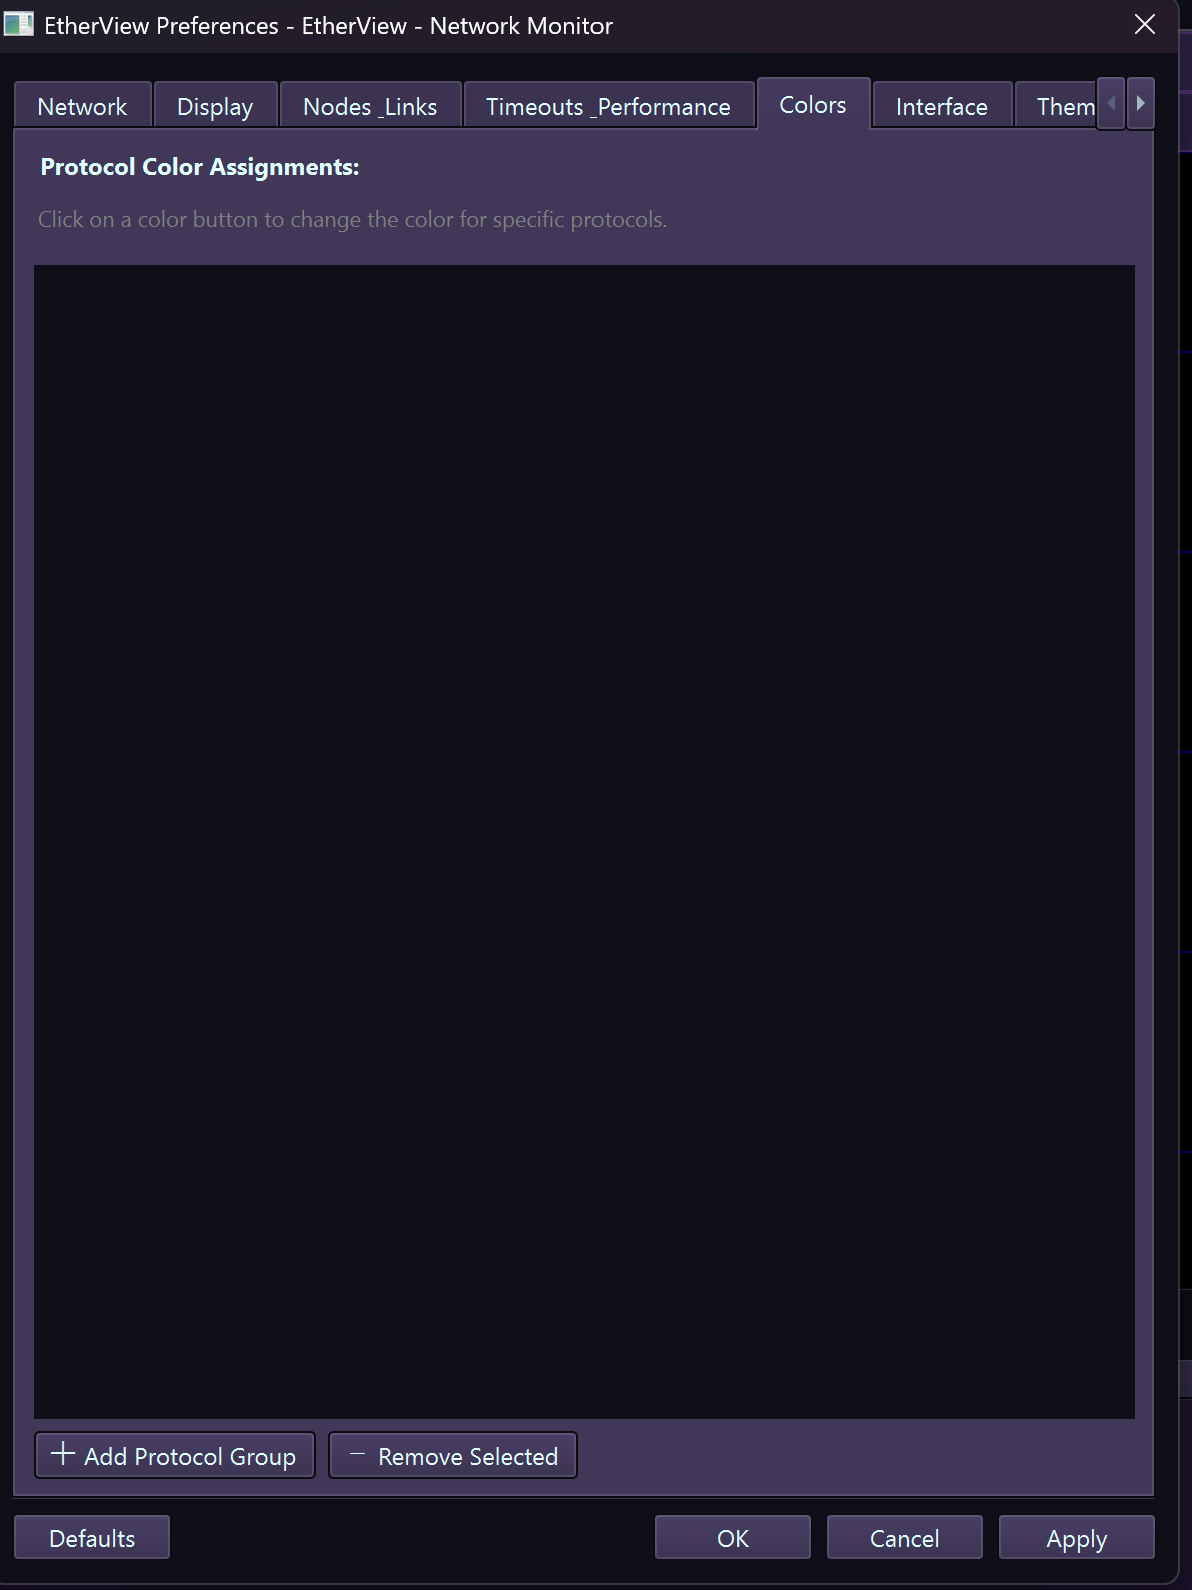
Custom Colors – Protocol color assignments
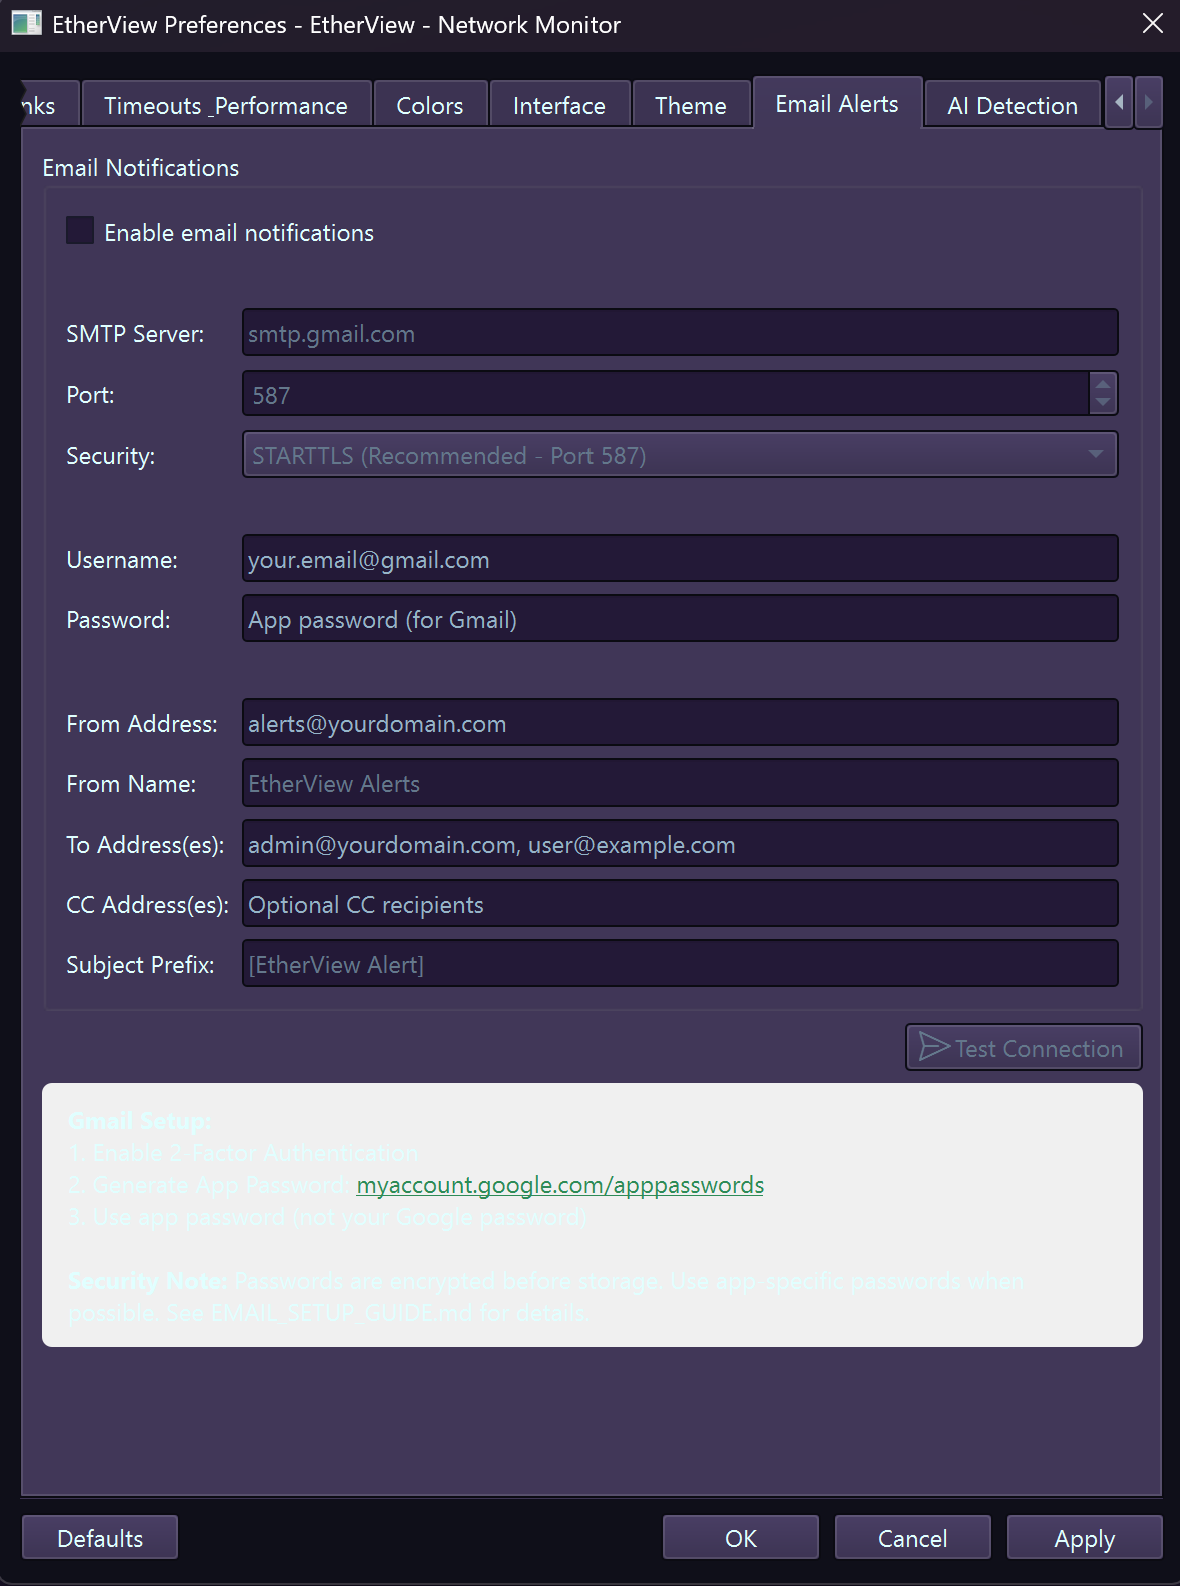
Email – SMTP configuration for alerts
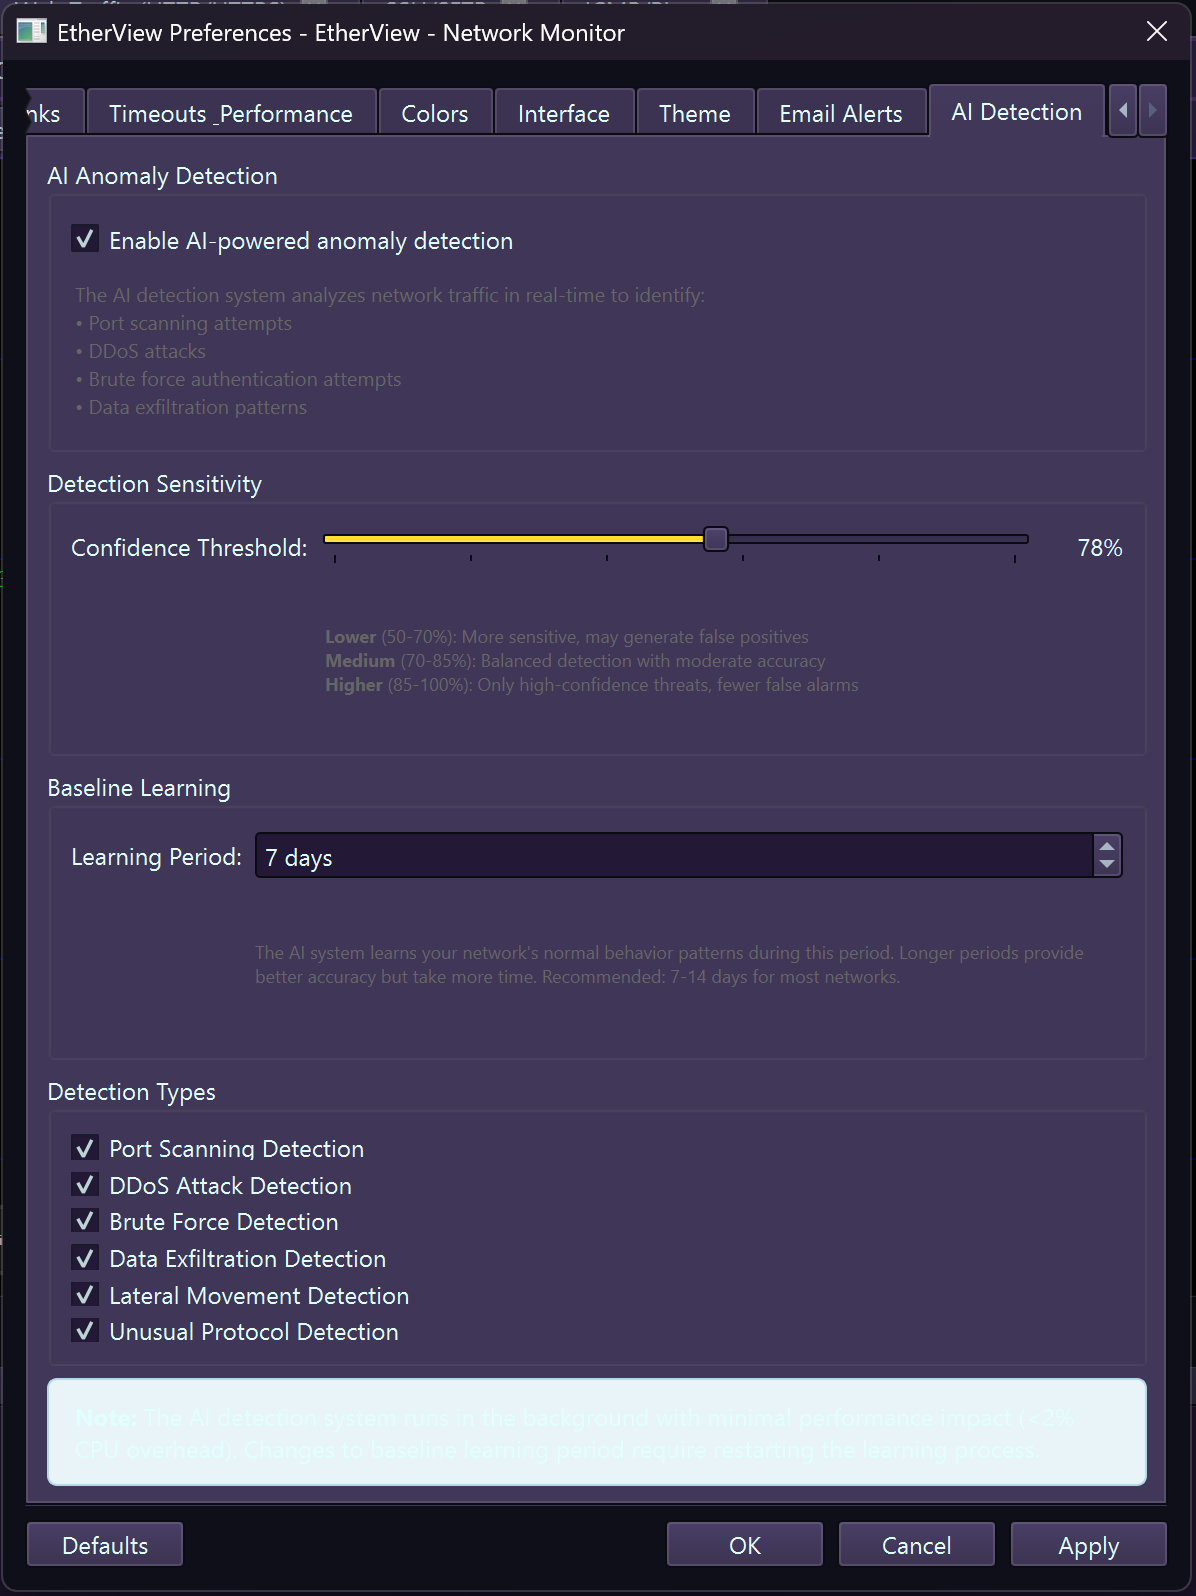
AI Detection – Threat detection thresholds
help Frequently Asked Questions
General
What makes EtherView different from Wireshark? expand_more
Can I capture traffic on a switched network? expand_more
Why do I need Administrator/root privileges? expand_more
setcap cap_net_raw+ep to grant capture permissions without running as root.
Licensing
How many devices can I activate with my license? expand_more
• Personal ($39.99/year): 1 device, 15-day offline grace period
• Personal Pro ($79.99/year): 5 devices, 15-day offline grace period
Business Tier:
• Business ($49.99/year): 1 device, full-term offline activation
• Business Pro ($199.99/year): 10 devices, full-term offline activation, priority support
You can deactivate devices from Account → Licenses to free up slots and reactivate on different machines.
Can I use EtherView without an internet connection? expand_more
Features
What protocols does deep packet inspection support? expand_more
Can I save and load capture files? expand_more
Can I monitor multiple network interfaces simultaneously? expand_more
What is the AI-powered Intrusion Detection System? expand_more
- Port Scanning Detection: Identifies hosts probing multiple ports
- DDoS Detection: Detects volume-based and connection flood attacks
- Brute Force Detection: Monitors for authentication attacks
- Data Exfiltration: Flags unusual outbound data transfers
- Lateral Movement: Detects internal network reconnaissance
- Unusual Protocols: Identifies unexpected protocol usage
How much network traffic can EtherView handle? expand_more
- Small networks (<50 nodes): Excellent performance on any modern system
- Medium networks (50-500 nodes): Good performance with recommended settings
- Large networks (500+ nodes): Requires tuning (filters, increased timeouts, limited animations)
Can I record and playback network sessions? expand_more
.4dlat format and can be exported to standard PCAP.
keyboard Keyboard Shortcuts
Capture
| Ctrl+E | Start/Stop capture |
| Ctrl+R | Restart capture |
| Ctrl+K | Clear captured packets |
| Ctrl+L | Activate License |
File
| Ctrl+O | Open capture file |
| Ctrl+S | Save capture |
| Ctrl+Shift+S | Save capture as... |
| Ctrl+Q | Quit application |
Tabs
| Ctrl+T | New tab |
| Ctrl+W | Close current tab |
| Ctrl+PgUp | Previous tab |
| Ctrl+PgDn | Next tab |
View
| Ctrl++ | Zoom in |
| Ctrl+- | Zoom out |
| Ctrl+0 | Reset zoom to 100% |
| F11 | Full screen toggle |
| F9 | Statistics panel |
Navigation
| Ctrl+F | Find packet |
| Ctrl+G | Go to packet number |
| Ctrl+N | Next match |
| Ctrl+Shift+N | Previous match |
Help
| F1 | Help documentation |
| Ctrl+, | Open Preferences |
Need More Help?
Can't find what you're looking for? Our support team is here to help.
contact_support Contact Support